 Back
BackCautions About Graphics in Statistics: Identifying and Avoiding Misleading Graphs
Study Guide - Smart Notes
 Tailored notes based on your materials, expanded with key definitions, examples, and context.
Section 3.4: Cautions About Graphics
Introduction
Graphs and visual representations are powerful tools in statistics for summarizing and communicating data. However, they can also be misleading if not constructed or interpreted carefully. This section discusses common ways in which graphics can distort data, intentionally or unintentionally, and provides guidance on how to critically evaluate statistical graphics.
Perceptual Distortions in Graphics
How Visual Elements Can Mislead
Many graphics are designed in ways that distort our perception of the underlying data. This can occur when the visual representation exaggerates or minimizes differences, leading to incorrect conclusions.
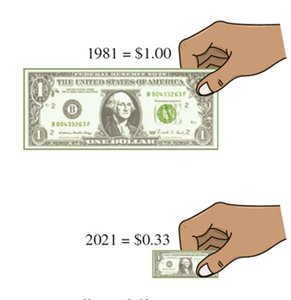
Length vs. Area: When using images (such as dollar bills) to represent quantities, the length of the image may be proportional to the value, but our eyes are often drawn to the area, which can exaggerate differences.
Example: A graphic showing the value of a dollar in 1981 versus 2021 may use the length of the bill to represent value, but the area appears much more different than the actual value difference, misleading the viewer.
Axis Values and Their Impact
Manipulating Axes to Change Perception
Changing the scale or starting point of an axis can dramatically alter the way data appears in a graph, even if the underlying data is the same.
Axis Truncation: Starting the y-axis at a value other than zero can exaggerate or minimize apparent differences.
Example: Two graphs showing the percentage of college students who are women since 1910 may look very different if the axes are scaled differently, even though the data is identical.
Nonlinear Scales
Linear vs. Logarithmic (Exponential) Scales
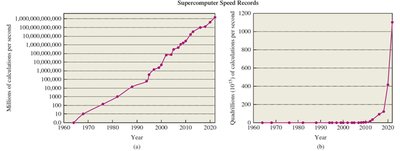
Some graphs use nonlinear scales, such as logarithmic or exponential scales, where each increment represents a multiplicative rather than additive change. This can make trends appear more or less dramatic than they are.
Logarithmic Scale: Each step on the axis represents a multiplication (e.g., powers of 10), which is useful for data that grows exponentially.
Linear Scale: Each step represents an equal additive change.
Example: Supercomputer speed records plotted on a logarithmic scale show steady progress, while the same data on a linear scale appears to have a sudden jump in recent years.
Percentage Change Graphs
Interpreting Percentage Change Carefully
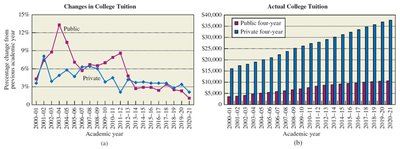
Graphs that show percentage change are common, especially in financial news. While they can be honest, they require careful interpretation to avoid being misled.
Percentage Change vs. Actual Values: A graph showing percentage change in college tuition may suggest costs are falling after a peak, but the actual cost may still be rising.
Example: Comparing a graph of percentage change in college tuition to a graph of actual tuition costs reveals that the cost continues to rise, even if the rate of increase slows.
Pictographs and Embellished Graphics
The Dangers of Decorative Elements
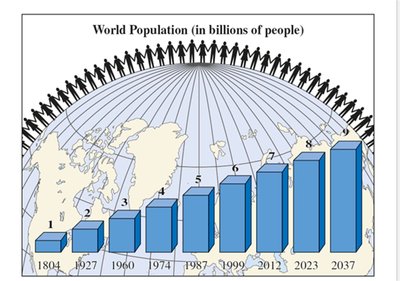
Pictographs use images or artwork to represent data. While they can make graphs more visually appealing, they often distract from or distort the actual data, especially if the size of the artwork is not proportional to the data values.
Artwork Distraction: Decorative elements can draw attention away from the data and may exaggerate differences.
Example: A pictograph showing world population growth with large, three-dimensional bars and figures may make the increase seem more dramatic than it is.
Case Studies: Misleading Graphs in the Media
Identifying Deceptive Practices
Many real-world examples illustrate how graphs can be misleading, whether through poor design or intentional manipulation. Common issues include inconsistent scales, truncated axes, and mislabeling.
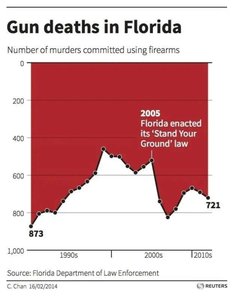
Truncated Axes: Not starting the y-axis at zero can exaggerate differences.
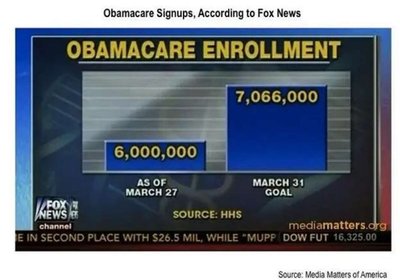
Inconsistent Bar Widths or Heights: Bars that are not proportional to the data values can mislead viewers.
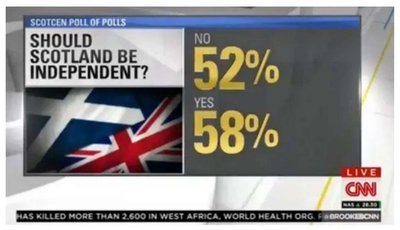
Incorrect Percentages: Poll results or pie charts that do not add up to 100% or are visually inconsistent with the numbers.
Example: A graph of gun deaths in Florida uses a truncated y-axis, making changes appear more dramatic.
Example: A bar chart of Obamacare signups uses bars of different widths or heights that are not proportional to the actual values.
Example: A poll result for Scottish independence shows percentages that add up to more than 100%, which is mathematically impossible.
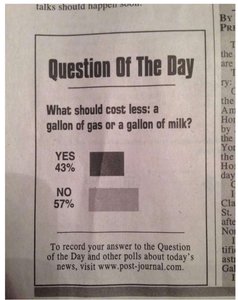
Example: A poll about gas and milk prices uses bar lengths that do not match the reported percentages.
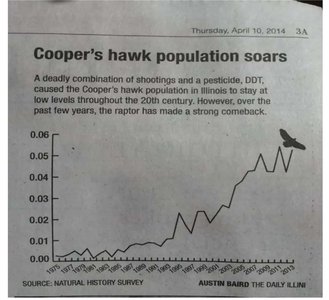
Example: A line graph of hawk population uses a y-axis with a very small range, exaggerating the apparent increase.
Summary Table: Common Graphical Misrepresentations
Type of Distortion | Description | Potential Effect |
|---|---|---|
Truncated Axis | Y-axis does not start at zero | Exaggerates differences between values |
Nonlinear Scale | Uses logarithmic or exponential scale without clear labeling | Makes trends appear more or less dramatic |
Pictographs | Uses images/artwork not proportional to data | Distracts or misleads viewer |
Incorrect Percentages | Percentages do not add up or are visually inconsistent | Confuses or misleads about actual proportions |
Bar/Line Width Manipulation | Bars or lines not proportional to data | Misrepresents magnitude of differences |
Best Practices for Interpreting and Creating Graphs
Always check axis scales and starting points.
Be cautious with pictographs and decorative elements.
Verify that percentages and proportions are mathematically correct.
Look for clear labeling of nonlinear scales.
Compare multiple representations of the same data when possible.
Conclusion
Understanding the potential for distortion in statistical graphics is essential for both interpreting and presenting data accurately. By being aware of common pitfalls and best practices, students can become more critical consumers and producers of statistical information.
