 Back
Central Limit Theorem and Sampling Distributions: Study Notes
Study Guide - Smart Notes
 Tailored notes based on your materials, expanded with key definitions, examples, and context.
Central Limit Theorem (CLT)
Definition and Importance
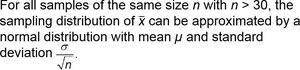
The Central Limit Theorem (CLT) is a fundamental concept in statistics that states: For all samples of the same size n with n > 30, the sampling distribution of the sample mean \( \bar{x} \) can be approximated by a normal distribution, regardless of the population's original distribution. The mean of this distribution is \( \mu \) and the standard deviation is \( \frac{\sigma}{\sqrt{n}} \).
Key Point: The CLT allows us to use normal probability methods for sample means, even when the population is not normal, provided the sample size is sufficiently large.
Formula:
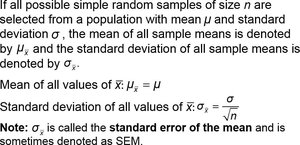
Standard Error: The standard deviation of the sampling distribution of the mean is called the standard error of the mean (SEM).
Sampling Distributions and Sample Size
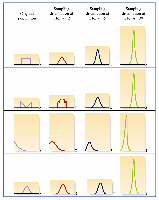
The shape of the sampling distribution of \( \bar{x} \) depends on the sample size and the population distribution. As sample size increases, the sampling distribution becomes more normal and less variable.
Key Point: If n > 30, the sampling distribution is approximately normal.
Visualization: Sampling distributions from different populations and sample sizes illustrate how the distribution becomes more normal as n increases.
Practical Application of the CLT
Requirements for Using the Normal Distribution
When working with sample means, verify that the normal distribution can be used by confirming that the original population is normal or the sample size is large (n > 30).
Key Point: Always check if the sample size is sufficient or if the population is normal before applying normal probability methods.
Individual Value vs. Sample Mean
It is important to distinguish whether you are using a normal distribution for a single value x or for the mean \( \bar{x} \) from a sample of n values.
Single Value: Use the population mean \( \mu \) and standard deviation \( \sigma \).
Sample Mean: Use the mean \( \mu \) and standard deviation \( \frac{\sigma}{\sqrt{n}} \) for the sampling distribution.
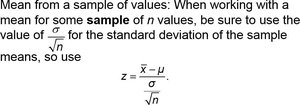
z-score for sample mean:


Examples and Applications
Example: Safe Loading of Elevators
This example demonstrates the difference between calculating probabilities for individual values and sample means using the normal distribution.
Scenario: The elevator has a maximum capacity of 4000 lb for 27 passengers, implying a mean passenger weight of 148 lb. Assume adult male weights are normally distributed with mean 189 lb and standard deviation 39 lb.
Part (a): Probability that one randomly selected adult male weighs more than 148 lb.
Part (b): Probability that the mean weight of 27 randomly selected adult males is more than 148 lb.
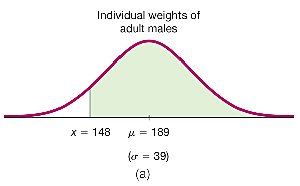
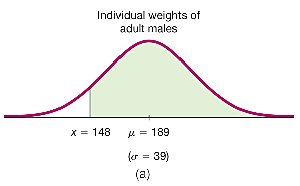
Solution (a): Individual Value
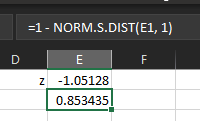
Calculate the z-score for x = 148:
Find the area to the right of x = 148 using Excel or normal tables: Probability ≈ 0.8534.
Solution (b): Sample Mean
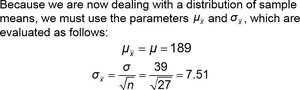
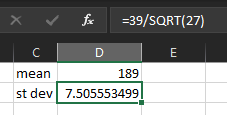
Calculate the mean and standard deviation for the sampling distribution:
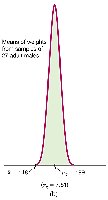
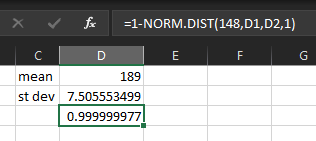
Find the probability that \( \bar{x} > 148 \) for a sample of 27 males.
Interpretation
There is a high probability (≈ 0.99999998) that the mean weight of 27 randomly selected males exceeds 148 lb, indicating the elevator is likely overloaded.
Example: Body Temperatures
This example illustrates the use of the CLT for a large sample size when the population distribution is unknown.
Scenario: Population mean body temperature is 98.6°F, standard deviation is 0.62°F. Sample size n = 106.
Task: Find the probability that the sample mean is 98.2°F or lower.
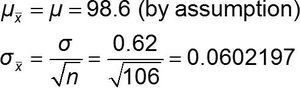
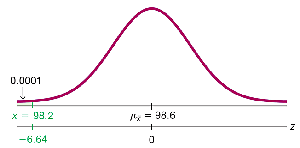
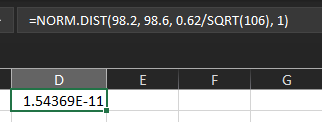
Calculate the mean and standard deviation for the sampling distribution:
Find the probability that \( \bar{x} \leq 98.2 \) using Excel or normal tables: Probability ≈ 0.0000000000154 (extremely small).
Summary Table: CLT Parameters and Applications
Parameter | Symbol | Formula | Description |
|---|---|---|---|
Mean of sample means | \( \mu_{\bar{x}} \) | \( \mu \) | Population mean |
Standard deviation of sample means (Standard Error) | \( \sigma_{\bar{x}} \) | \( \frac{\sigma}{\sqrt{n}} \) | Standard error of the mean |
z-score for sample mean | z | \( \frac{\bar{x} - \mu}{\sigma / \sqrt{n}} \) | Standardized value for sample mean |
Additional info: The notes above expand on the original content by providing definitions, formulas, and context for the Central Limit Theorem, sampling distributions, and practical applications. All included images directly reinforce the statistical concepts and calculations discussed in the paragraphs.
