 Back
Chapter 1: Data Collection and Introduction to Statistics
Study Guide - Smart Notes
 Tailored notes based on your materials, expanded with key definitions, examples, and context.
Statistics: Informed Decisions Using Data
Introduction to Statistics
Statistics is the science of collecting, organizing, summarizing, and analyzing information to draw conclusions or answer questions. It also provides a measure of confidence in any conclusions. The information used in statistics is called data, which are facts or propositions used to draw conclusions or make decisions. Data describe characteristics of individuals and are subject to variability.
Variability: Data vary among individuals and even within the same individual over time.
Goal: One goal of statistics is to describe and understand sources of variability.
Types of Statistics
Descriptive Statistics: Organizing and summarizing data using numerical summaries, tables, and graphs.
Inferential Statistics: Methods that take results from a sample, extend them to the population, and measure the reliability of the result.
Parameter: Numerical summary of a population.
Statistic: Numerical summary based on a sample.
Example: Parameter vs. Statistic
If 48.2% of all students own a car, this is a parameter.
If 46% of a sample of 100 students own a car, this is a statistic.
The Process of Statistics
Steps in the Statistical Process
Identify the Research Objective: Clearly define the question and population to be studied.
Collect Data: Gather data needed to answer the question, often from a sample due to practical constraints.
Describe the Data: Use descriptive statistics to obtain an overview and determine appropriate methods.
Perform Inference: Apply techniques to extend sample results to the population and report reliability.
Example: Trust Your Neighbor Survey
Population: Adult Americans
Sample: 1628 surveyed, 847 trust all or most neighbors
Descriptive Statistic: 52% trust all or most neighbors
Inference: 95% certain the true percentage is between 49.5% and 54.5% (margin of error ±2.5%)
Variables and Data Types
Definition of Variables
Variables are characteristics of individuals within the population. Variables vary, and understanding this variability is a key research goal.
Types of Variables
Quantitative Variables: Provide numerical measures; values can be meaningfully added or subtracted.
Qualitative (Categorical) Variables: Allow classification based on attributes or characteristics.
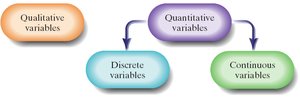
Quantitative Variable Subtypes
Discrete Variables: Finite or countable values (e.g., number of cars).
Continuous Variables: Infinite values, measurable to any desired accuracy (e.g., distance, time).
Between any two values of a continuous variable, there are infinitely many possible values.
Examples: Distinguishing Variable Types
Race: Qualitative
Temperature: Quantitative
Number of study days: Quantitative
Zip code: Qualitative
Data Classification
Qualitative Data: Observations from qualitative variables.
Quantitative Data: Observations from quantitative variables.
Discrete Data: Observations from discrete variables.
Continuous Data: Observations from continuous variables.
Example: Parking Meter Data
Table 1 presents data from a sample of on-street parking meters in Seattle. The individuals are cars; variables include payment method, amount paid, duration, side of street, and parking space number.
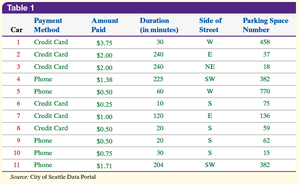
Qualitative variables: Payment method, side of street, parking space number
Quantitative variables: Amount paid (discrete), duration (continuous)
Levels of Measurement
Nominal Level
Values name, label, or categorize; no ranked order.
Ordinal Level
Values can be ranked or ordered.
Interval Level
Ranked values; differences have meaning; zero does not mean absence of quantity.
Ratio Level
Ranked values; differences and ratios have meaning; zero means absence of quantity.
Examples: Levels of Measurement
Gender: Nominal
Temperature (°F): Interval
Number of study days: Ratio
Letter grade: Ordinal
Years of cicada emergence: Interval
Observational Studies vs. Experiments
Observational Study
Measures the value of the response variable without influencing variables. Only association can be claimed, not causation.
Designed Experiment
Researcher manipulates explanatory variables and records response variable. Allows for causation claims.
Confounding and Lurking Variables
Confounding Variable: Effects cannot be separated from other explanatory variables.
Lurking Variable: Not considered in the study but affects the response variable.
Observational studies are subject to confounding and lurking variables, limiting causal inference.
Types of Observational Studies
Cross-sectional: Information at a specific point in time.
Case-control: Retrospective, comparing individuals with and without certain characteristics.
Cohort: Prospective, following a group over time.
Sampling Methods
Random Sampling
Chance is used to select individuals, ensuring representativeness.
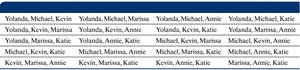
Simple Random Sampling
Every possible sample of size n has an equally likely chance of occurring.
Other Sampling Methods
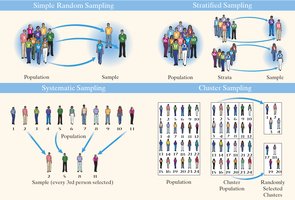
Systematic Sampling: Select every kth individual after a random start.
Stratified Sampling: Divide population into homogeneous strata, sample from each.
Cluster Sampling: Divide population into groups, randomly select groups, survey all individuals in selected groups.
Convenience Sampling: Individuals easily obtained; results are suspect.
Multistage Sampling: Combination of methods, often used in large-scale surveys.
Bias and Errors in Sampling
Types of Bias
Sampling Bias: Technique favors one part of the population.
Nonresponse Bias: Individuals who do not respond differ from those who do.
Response Bias: Answers do not reflect true feelings due to interviewer error, misrepresented answers, wording, ordering, or question type.
Types of Errors
Nonsampling Errors: Undercoverage, nonresponse, response bias, data-entry error.
Sampling Error: Sample does not accurately represent the population.
Experimental Design
Key Concepts
Experiment: Controlled study to determine effect of explanatory variables (factors) on response variable.
Treatment: Combination of factor values applied to experimental units.
Experimental Unit: Person, object, or item receiving treatment.
Control Group: Baseline treatment for comparison.
Placebo: Inert treatment resembling the experimental treatment.
Blinding: Nondisclosure of treatment received; single-blind (subject unaware), double-blind (subject and researcher unaware).
Example: Lipitor Experiment
Population: Individuals aged 40–75 with type 2 diabetes, no prior cardiovascular disease
Sample: 2838 subjects
Treatments: Lipitor 10 mg daily or placebo
Response Variable: Occurrence of major cardiovascular event (qualitative)
Results: Lipitor group had fewer major events and deaths compared to placebo group
Summary Table: Sampling Methods
Sampling Method | Description | Advantages | Disadvantages |
|---|---|---|---|
Simple Random | Every sample equally likely | Unbiased, easy to analyze | May require complete list (frame) |
Systematic | Select every kth individual | Easy to implement | May introduce periodic bias |
Stratified | Divide into strata, sample from each | Ensures representation of subgroups | Requires knowledge of strata |
Cluster | Divide into groups, sample groups | Efficient for large populations | May not represent entire population |
Convenience | Sample easily obtained individuals | Quick, inexpensive | Results often biased |
Key Formulas
Margin of Error:
Sample Proportion:
Additional info: Academic context and examples were expanded for clarity and completeness. All images included are directly relevant to the explanation of the adjacent paragraphs.
