 Back
BackChapter 1: Data Collection – Foundations of Statistical Thinking and Sampling Methods
Study Guide - Smart Notes
 Tailored notes based on your materials, expanded with key definitions, examples, and context.
Data Collection
Introduction to the Practice of Statistics
Statistics is the science of collecting, organizing, summarizing, and analyzing information to draw conclusions or answer questions. It also involves providing a measure of confidence in any conclusions. The information used in statistics is called data, which describes characteristics of individuals and exhibits variability.
Statistics: The science of data analysis for decision-making.
Data: Facts or propositions used to draw conclusions or make decisions.
Variability: The tendency of data to differ among individuals or over time.
Example: Heights, hours of sleep, and calorie intake all vary among individuals and over time.
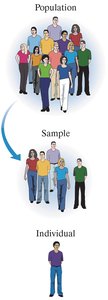
The Process of Statistics
The process of statistics involves four main steps:
Identify the research objective: Clearly state the question and population of interest.
Collect the data: Gather data from a sample, as studying the entire population is often impractical.
Describe the data: Use descriptive statistics (numerical summaries, tables, graphs) to summarize the sample.
Perform inference: Use inferential statistics to extend sample results to the population and measure reliability.
Key Terms:
Population: The entire group of individuals to be studied.
Sample: A subset of the population.
Parameter: Numerical summary of a population.
Statistic: Numerical summary of a sample.
Descriptive statistics: Methods for summarizing data.
Inferential statistics: Methods for making generalizations from a sample to a population.
Types of Variables
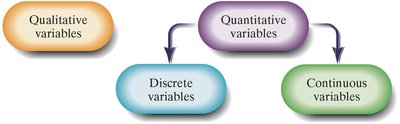
Variables are characteristics of individuals in a population. They can be classified as:
Qualitative (Categorical) Variables: Classify individuals based on attributes or characteristics (e.g., hair color, education level).
Quantitative Variables: Provide numerical measures (e.g., height, age, income).
Discrete Variables: Quantitative variables with countable values (e.g., number of students).
Continuous Variables: Quantitative variables with infinite, uncountable values within a range (e.g., weight, temperature).
Levels of Measurement
Variables can be measured at different levels:
Nominal: Values name, label, or categorize without order (e.g., gender, phone type).
Ordinal: Values can be ranked or ordered (e.g., satisfaction ratings).
Interval: Ordered values with meaningful differences, but zero does not mean absence (e.g., temperature in Celsius).
Ratio: Ordered values with meaningful differences and ratios; zero means absence (e.g., income, age).
Observational Studies Versus Designed Experiments
Observational Studies and Experiments
In research, we distinguish between observational studies and experiments:
Observational Study: Measures the value of the response variable without influencing variables. Can show association, not causation.
Designed Experiment: Researcher assigns treatments to study the effect on the response variable. Can establish causation.
Confounding: Occurs when the effects of two or more explanatory variables are not separated.
Lurking Variable: An unmeasured variable that affects the response variable.
Types of Observational Studies
Cross-sectional Studies: Collect data at a specific point in time.
Case-control Studies: Retrospective; compare individuals with and without a characteristic.
Cohort Studies: Prospective; follow a group over time to observe outcomes.
Sampling Methods
Simple Random Sampling
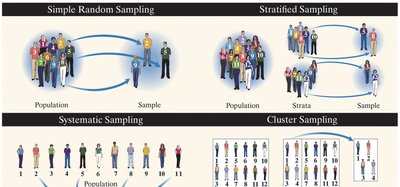
Simple random sampling ensures every possible sample of size n from a population of size N has an equal chance of selection. Steps include listing all individuals, numbering them, and randomly selecting numbers.
Other Effective Sampling Methods
Stratified Sampling: Divide the population into homogeneous groups (strata), then randomly sample from each stratum.
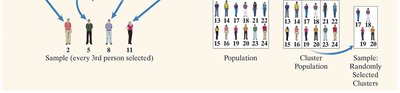
Systematic Sampling: Select every kth individual from a list, starting at a random point.
Cluster Sampling: Divide the population into groups (clusters), randomly select some clusters, and include all individuals from those clusters.
Convenience Sampling: Select individuals easily obtained; not random and often biased.
Bias in Sampling
Sources of Bias
Sampling Bias: Sampling method favors one part of the population.
Nonresponse Bias: Individuals selected do not respond, and their opinions differ from responders.
Response Bias: Survey answers do not reflect true feelings due to interviewer error, question wording, or order.
Data-entry Error: Mistakes in recording or entering data.
Nonsampling Error: Errors from bias or data-entry mistakes, not from the act of sampling.
Sampling Error: Error from using a sample to estimate population information.
The Design of Experiments
Characteristics of an Experiment
Experiment: Controlled study to determine the effect of explanatory variables (factors) on a response variable.
Treatment: Any combination of factor values.
Experimental Unit: The subject or object receiving a treatment.
Control Group: Baseline group for comparison, may receive a placebo.
Placebo Effect: Improvement due to the belief in treatment, not the treatment itself.
Blinding: Subjects (single-blind) or both subjects and researchers (double-blind) do not know treatment assignments.
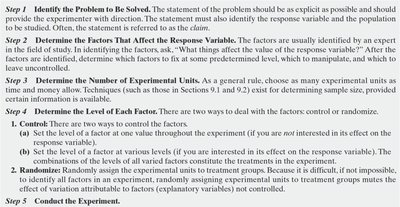
Steps in Designing an Experiment
Identify the problem and population.
Determine factors affecting the response variable.
Determine the number of experimental units.
Determine the level of each factor.
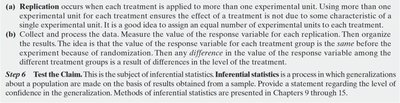
Conduct the experiment and collect data.
Test the claim using statistical methods.
Experimental Designs
Completely Randomized Design: Experimental units are randomly assigned to treatments.
Matched-Pairs Design: Experimental units are paired (e.g., before/after, twins), and each pair receives both treatments in random order.
Randomized Block Design: Experimental units are grouped into homogeneous blocks, and treatments are randomly assigned within each block.
Random Sampling vs. Random Assignment
Random Sampling: Individuals are randomly selected from the population, allowing generalization to the population.
Random Assignment: Individuals are randomly assigned to treatment groups, allowing causal inference.
Additional info: This summary covers all foundational concepts from Chapter 1, including definitions, examples, and diagrams for key statistical ideas and sampling methods. The included images directly reinforce the explanations of population/sample/individual, variable types, sampling methods, and experimental design.
