 Back
BackChapter 1: Data Collection – Foundations of Statistical Practice
Study Guide - Smart Notes
 Tailored notes based on your materials, expanded with key definitions, examples, and context.
Section 1.1: Introduction to the Practice of Statistics
Definition and Scope of Statistics
Statistics is the science of collecting, organizing, summarizing, and analyzing information to draw conclusions or answer questions. It also involves providing a measure of confidence in any conclusions. The information used in statistics is called data, which describes characteristics of individuals and exhibits variability.
Statistics: The science of data analysis and interpretation.
Data: Facts or propositions used to draw conclusions or make decisions.
Variability: The tendency of data to differ among individuals or over time.
Statistical Thinking: Understanding and accounting for variability in data.
Example: Data in everyday life includes news reports, social media metrics, and personal health records.
The Process of Statistics
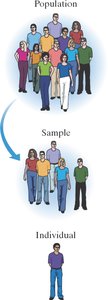
The statistical process consists of four main steps: identifying the research objective, collecting data, describing data, and performing inference. This process ensures that conclusions are meaningful and reliable.
Population: The entire group of individuals to be studied.
Sample: A subset of the population selected for study.
Descriptive Statistics: Methods for organizing and summarizing data (numerical summaries, tables, graphs).
Inferential Statistics: Methods for extending sample results to the population and measuring reliability.
Parameter: Numerical summary of a population.
Statistic: Numerical summary based on a sample.
Example: In a campus survey, the proportion of all students with jobs is a parameter; the proportion in a sample is a statistic.
Steps in the Statistical Process
Identify the research objective.
Collect the data needed to answer the question(s).
Describe the data using descriptive statistics.
Perform inference to extend sample results to the population.
Section 1.1: Types of Variables
Qualitative vs. Quantitative Variables
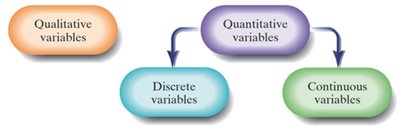
Variables are characteristics of individuals within a population. They can be classified as qualitative or quantitative, and quantitative variables can further be classified as discrete or continuous.
Qualitative (Categorical) Variables: Allow classification based on attributes or characteristics (e.g., gender, education level).
Quantitative Variables: Provide numerical measures that can be meaningfully added or subtracted (e.g., height, temperature).
Discrete Variables: Quantitative variables with a finite or countable number of values (e.g., number of vending machines).
Continuous Variables: Quantitative variables with an infinite number of values, not countable (e.g., sleep duration, gas mileage).
Example: Education level is qualitative; daily intake of whole grains is quantitative and continuous; number of vending machines is quantitative and discrete.
Levels of Measurement
The level of measurement of a variable determines the type of statistical analysis that can be performed.
Nominal: Values name, label, or categorize; no ranking (e.g., gender).
Ordinal: Values can be ranked or ordered (e.g., income status).
Interval: Differences between values have meaning; zero does not indicate absence (e.g., temperature in Celsius).
Ratio: Ratios of values have meaning; zero indicates absence (e.g., income, number of children).
Example: Grade earned in Algebra (percentage) is ratio; response to a survey question (strongly agree, agree, etc.) is ordinal.
Section 1.2: Observational Studies Versus Designed Experiments
Observational Study vs. Experiment
Research studies can be classified as observational or experimental based on whether the researcher manipulates variables.
Observational Study: Measures the value of the response variable without influencing explanatory variables.
Designed Experiment: Researcher manipulates explanatory variables and controls other variables, then records the response.
Confounding: Occurs when effects of two or more explanatory variables are not separated.
Lurking Variable: An unconsidered variable that affects the response variable.
Example: Flu shot study may be confounded by health status or access to healthcare.
Types of Observational Studies
Cross-sectional Studies: Collect information at a specific point in time.
Case-control Studies: Retrospective; compare individuals with and without certain characteristics.
Cohort Studies: Prospective; follow a group over time and record characteristics.
Example: Psychological effects of evacuation during WWII (case-control); tracking adolescents with prehypertension (cohort).
Section 1.3 & 1.4: Sampling Methods
Simple Random Sampling
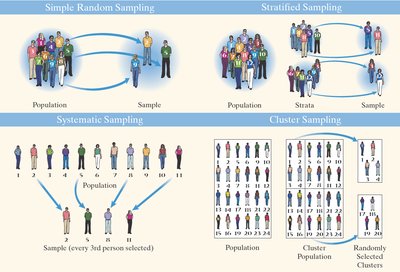
Simple random sampling ensures every possible sample of size n from a population of size N has an equal chance of being selected.
Frame: List of all individuals in the population.
Random Number Generation: Used to select individuals for the sample.
Example: Selecting 5 members from the House of Representatives for a luncheon.
Other Effective Sampling Methods
Stratified Sampling: Divide population into homogeneous strata, then sample from each stratum.
Systematic Sampling: Select every kth individual after a random start.
Cluster Sampling: Divide population into groups, randomly select groups, and sample all individuals in selected groups.
Convenience Sampling: Individuals are easily obtained, not random; results are often biased.
Example: Stratified sampling in Congress; systematic sampling in university study; cluster sampling in nursing homes.
Section 1.5: Bias in Sampling
Sources of Bias
Bias occurs when a sample is not representative of the population. Understanding sources of bias is crucial for reliable statistical inference.
Sampling Bias: Technique favors one part of the population.
Nonresponse Bias: Individuals who do not respond differ from those who do.
Response Bias: Survey answers do not reflect true feelings (interviewer error, misrepresented answers, question wording).
Data-entry Error: Mistakes in recording data.
Nonsampling Error: Errors from bias or data-entry, can occur even in a census.
Sampling Error: Error from using a sample to estimate population information.
Example: Robocalls and internet polling may lead to nonresponse and sampling bias.
Section 1.6: The Design of Experiments
Characteristics of an Experiment
An experiment is a controlled study to determine the effect of varying explanatory variables (factors) on a response variable. Treatments are combinations of factor values applied to experimental units.
Experimental Unit: The subject or object receiving a treatment.
Control Group: Baseline treatment for comparison.
Placebo: An innocuous treatment used to control for psychological effects.
Placebo Effect: Improvement due to belief in treatment rather than the treatment itself.
Blinding: Nondisclosure of treatment; single-blind (subject unaware), double-blind (subject and researcher unaware).
Example: Double-blind, placebo-controlled experiment with cyclists and sports drinks.
Steps in Designing an Experiment
Designing an experiment involves careful planning to control confounding and ensure valid results.
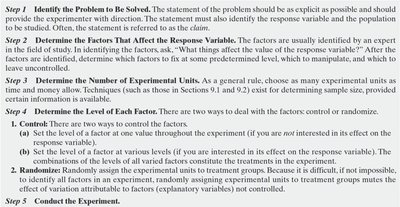
Step 1: Identify the problem to be solved.
Step 2: Determine factors affecting the response variable.
Step 3: Determine the number of experimental units.
Step 4: Determine the level of each factor (control or randomize).
Step 5: Conduct the experiment.
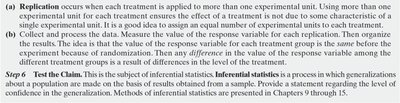
Replication and Data Collection
Replication: Applying each treatment to multiple units to ensure reliability.
Data Collection: Measure and organize response variables for each replication.
Test the Claim: Use inferential statistics to generalize results to the population.
Completely Randomized Design
In a completely randomized design, each experimental unit is randomly assigned to a treatment. This design helps eliminate bias and confounding.
Example: Random assignment of women to computer class, exercise program, or normal routine; age-satisfaction score measured.
Randomization: Ensures equal chance for each unit to receive any treatment.
Matched-Pairs Design
Experimental units are paired based on relatedness (e.g., twins, before-and-after measurements). Each pair receives both treatments, and comparisons are made within pairs.
Example: Children taste milk with and without xylitol; ratings compared within each child.
Only two levels of treatment: Each pair receives both treatments.
Summary Table: Sampling Methods
Sampling Method | Description | Example |
|---|---|---|
Simple Random | Every sample has equal chance | Randomly select 5 representatives |
Stratified | Divide into strata, sample from each | Sample from political groups in Congress |
Systematic | Select every kth individual | Every 40th student in university |
Cluster | Randomly select groups, sample all in group | Sample all residents in selected nursing homes |
Convenience | Easy to obtain, not random | Surveying friends |
Summary Table: Levels of Measurement
Level | Properties | Example |
|---|---|---|
Nominal | Name, label, categorize | Gender |
Ordinal | Ranked order | Income status |
Interval | Meaningful differences, no true zero | Temperature (Celsius) |
Ratio | Meaningful ratios, true zero | Income, number of children |
Additional info: Academic context and examples have been expanded for clarity and completeness. Tables have been recreated for comparison and classification purposes.
