 Back
BackChapter 1: Data Collection – Foundations of Statistical Study
Study Guide - Smart Notes
 Tailored notes based on your materials, expanded with key definitions, examples, and context.
Data Collection and Statistical Thinking
Introduction to Statistics
Statistics is the science of collecting, organizing, analyzing, and interpreting data to make decisions. Data are facts or propositions used to draw conclusions or make decisions, and they describe characteristics of individuals. A key aspect of data is variability, which refers to the differences observed among individuals or measurements.
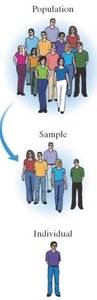
Population: The entire group of individuals to be studied.
Individual: A person or object that is a member of the population.
Sample: A subset of the population that is being studied.
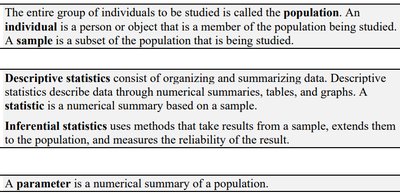
Descriptive statistics involve organizing and summarizing data using numerical summaries, tables, and graphs. Inferential statistics use methods that take results from a sample, extend them to the population, and measure the reliability of the result. A statistic is a numerical summary based on a sample, while a parameter is a numerical summary of a population.
Types of Variables and Data
Qualitative and Quantitative Variables
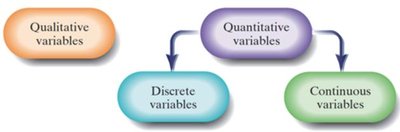
Variables are characteristics of individuals within the population. They can be classified as:
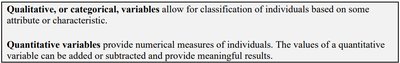
Qualitative (Categorical) Variables: Classify individuals based on some attribute or characteristic (e.g., gender, hair color).
Quantitative Variables: Provide numerical measures of individuals. The values can be added or subtracted and provide meaningful results (e.g., height, age).
Discrete and Continuous Variables
Quantitative variables can be further classified as:
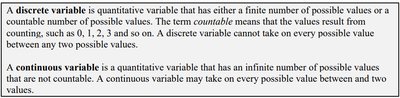
Discrete Variables: Have either a finite or countable number of possible values (e.g., number of children).
Continuous Variables: Have an infinite number of possible values that are not countable, often measured (e.g., height, weight).
Levels of Measurement
Scales of Measurement
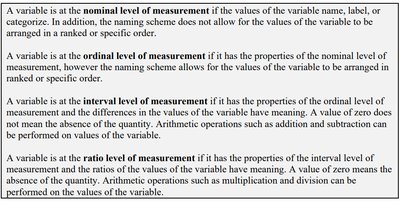
The level of measurement of a variable determines the type of statistical analysis that can be performed:
Nominal Level: Values name, label, or categorize. No order is implied (e.g., gender).
Ordinal Level: Values can be ranked or ordered, but differences are not meaningful (e.g., education level).
Interval Level: Differences between values are meaningful, but ratios are not. Zero does not mean absence (e.g., temperature in Celsius).
Ratio Level: Ratios of values are meaningful, and zero means absence of the quantity (e.g., height, weight).
Types of Studies
Observational Studies and Experiments
In statistics, studies are designed to investigate relationships between variables:
Observational Study: The researcher observes and measures characteristics without influencing the variables.
Designed Experiment: The researcher assigns individuals to groups, manipulates an explanatory variable, and observes the effect on the response variable.
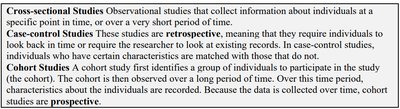
Observational studies can be further classified as:
Cross-sectional Studies: Collect information at a specific point in time.
Case-control Studies: Retrospective; individuals look back in time or researchers use existing records.
Cohort Studies: Prospective; a group is followed over time to record characteristics.
Sampling Methods
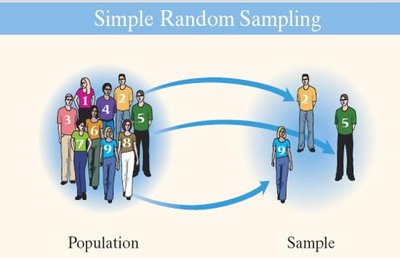
Simple Random Sampling
Simple random sampling ensures every individual in the population has an equal chance of being selected. This method is the foundation for most probability-based sampling techniques.
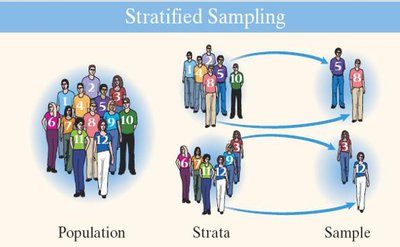
Stratified Sampling
Stratified sampling divides the population into homogeneous groups (strata) and selects a random sample from each group. This method ensures representation from each subgroup and reduces variability in estimates.
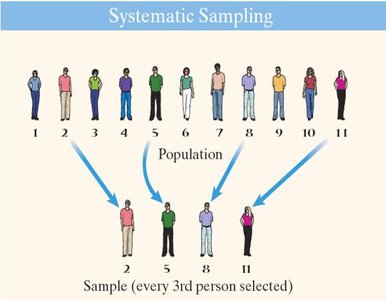
Systematic Sampling
Systematic sampling selects every k-th individual from a list of the population after randomly selecting a starting point. It is easier to administer but less random than simple random sampling.
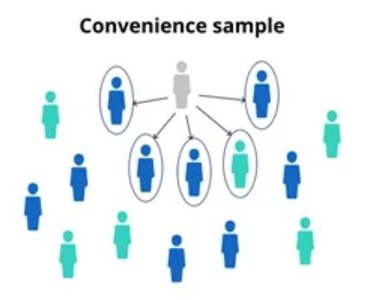
Convenience Sampling
Convenience sampling selects individuals who are easiest to reach. This method is prone to bias and should be avoided in scientific studies.
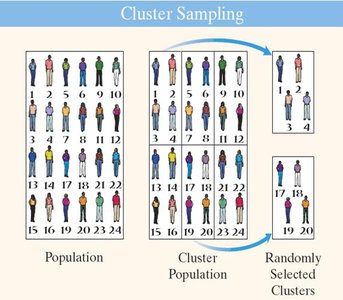
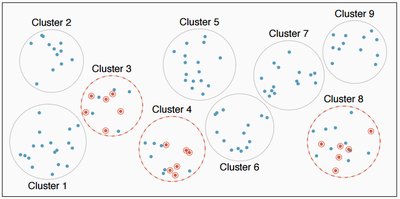
Cluster Sampling
Cluster sampling divides the population into clusters, randomly selects some clusters, and includes all individuals from those clusters in the sample. Clusters should be heterogeneous and resemble the population.
Bias in Sampling
Sources of Bias
Bias occurs when the sample does not accurately represent the population. Common sources include:
Sampling Bias (Selection Bias): Some segments of the population are systematically excluded.
Undercoverage: A segment of the population is underrepresented in the sample.
Convenience Sample: Individuals are chosen based on ease of access, not randomness.
Voluntary Response Sample: Individuals self-select to participate, often those with strong opinions.
Nonresponse Bias: Selected individuals do not respond, and their opinions differ from those who do.
Response Bias: Survey answers do not reflect true feelings due to interviewer error, misrepresented answers, question wording, or order.
Data-entry Error: Mistakes in recording or entering data can lead to inaccurate results.
Nonsampling errors result from bias or errors in the data collection process, while sampling error arises from using a sample to estimate population information.
Summary Table: Sampling Methods
Sampling Method | Description | Strengths | Weaknesses |
|---|---|---|---|
Simple Random | Every individual has equal chance of selection | Unbiased, easy to analyze | May be difficult for large populations |
Stratified | Population divided into strata, random sample from each | Ensures subgroup representation | Requires knowledge of strata |
Systematic | Select every k-th individual after random start | Simple, quick | Can introduce periodicity bias |
Cluster | Randomly select clusters, sample all in clusters | Cost-effective, practical | Clusters may not represent population well |
Convenience | Sample easiest to reach individuals | Easy, fast | Highly biased, not representative |
