 Back
BackChapter 1: Data Collection – Structured Study Notes for Statistics
Study Guide - Smart Notes
 Tailored notes based on your materials, expanded with key definitions, examples, and context.
Chapter 1: Data Collection
1.1 Introduction to the Practice of Statistics
Statistics is the science of collecting, organizing, summarizing, and analyzing information to draw conclusions or answer questions. It also provides a measure of confidence in any conclusions. The information used in statistics is called data, which describes characteristics of individuals and exhibits variability.
Population: The entire group of individuals to be studied.
Sample: A subset of the population being studied.
Parameter: A numerical summary of a population.
Statistic: A numerical summary based on a sample.
Descriptive statistics: Organizing and summarizing data using numerical summaries, tables, and graphs.
Inferential statistics: Methods that take results from a sample, extend them to the population, and measure reliability.
Example: If 48.2% of all students own a car (parameter), but a sample of 100 students shows 46% own a car (statistic).
The process of statistics involves:
Identifying the research objective.
Collecting data appropriately.
Describing the data.
Performing inference to generalize results and report reliability.
1.1 Variables and Data Types
Variables are characteristics of individuals in the population and can be classified as:
Qualitative (Categorical) variables: Classify individuals based on attributes or characteristics (e.g., gender, zip code).
Quantitative variables: Provide numerical measures (e.g., temperature, number of days studied).
Quantitative variables are further classified as:
Discrete variables: Finite or countable values (e.g., number of cars).
Continuous variables: Infinite possible values, measured to any desired accuracy (e.g., distance traveled).
Data are the observations a variable assumes. Qualitative data correspond to qualitative variables, and quantitative data correspond to quantitative variables.
1.1 Levels of Measurement
Variables can be measured at different levels:
Nominal: Names, labels, or categorizes without ranking (e.g., gender).
Ordinal: Categorizes and allows ranking (e.g., letter grades).
Interval: Differences have meaning, but zero does not mean absence (e.g., temperature).
Ratio: Ratios have meaning, and zero means absence (e.g., number of days studied).
1.2 Observational Studies Versus Designed Experiments
Observational studies measure the value of the response variable without influencing variables, while designed experiments assign treatments and observe outcomes.
Observational Study: No intervention; only association can be claimed.
Designed Experiment: Researcher assigns treatments; causation may be inferred.
Confounding occurs when effects of multiple variables cannot be separated. Lurking variables are unaccounted explanatory variables affecting the response.
Types of observational studies:
Cross-sectional: Information at a specific point in time.
Case-control: Retrospective, comparing individuals with and without certain characteristics.
Cohort: Prospective, following a group over time.
1.2 Census Data and Web Scraping
A census collects data from all individuals in a population. Web scraping is extracting data from the Internet, raising ethical considerations.
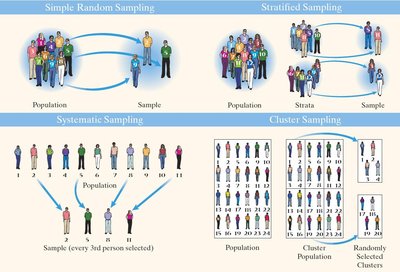
1.3 Simple Random Sampling
Simple random sampling uses chance to select individuals, ensuring every possible sample has an equal chance of selection.
Obtain a frame listing all individuals.
Number individuals and use a random number generator to select the sample.
Example: Selecting 3 friends from 6 for a concert; each group of 3 has a 1/20 chance.
1.4 Other Effective Sampling Methods
Other sampling methods include:
Stratified Sampling: Divide population into homogeneous strata, then sample from each stratum.
Systematic Sampling: Select every kth individual after a random start.
Cluster Sampling: Randomly select groups (clusters) and sample all individuals within them.
Multistage Sampling: Combine multiple sampling techniques in stages.
Convenience Sampling: Uses easily obtained individuals; results are often biased and unreliable.
1.5 Bias in Sampling
Bias occurs when the sample is not representative of the population. Main sources:
Sampling bias: Technique favors part of the population.
Nonresponse bias: Selected individuals do not respond and differ from responders.
Response bias: Survey answers do not reflect true feelings due to interviewer error, misrepresented answers, wording, order, or question type.
Data-entry error: Mistakes in recording data.
Nonsampling errors arise from bias or data-entry errors and can occur even in a census. Sampling error results from using a sample to estimate population information.
1.6 The Design of Experiments
An experiment is a controlled study to determine the effect of varying explanatory variables (factors) on a response variable. Treatments are combinations of factor values.
Experimental unit: The subject receiving treatment.
Control group: Baseline for comparison.
Placebo: Inactive treatment resembling the experimental treatment.
Blinding: Nondisclosure of treatment to subjects or researchers.
Single-blind: Subjects do not know their treatment.
Double-blind: Neither subjects nor researchers know the treatment assignments.
Steps in designing an experiment:
Identify the problem and response variable.
Determine factors affecting the response.
Choose the number of experimental units.
Set levels for each factor and randomize assignments.
Conduct the experiment and replicate treatments.
Test the claim using inferential statistics.
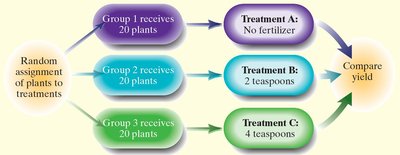
Completely Randomized Design: Each experimental unit is randomly assigned to a treatment group.
Matched-Pairs Design
In a matched-pairs design, experimental units are paired based on related characteristics, and each pair receives two levels of treatment. Differences in outcomes are attributed to the treatment.
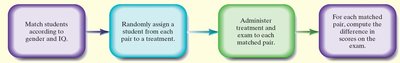
Example: Matching students by IQ and gender, assigning one to a quiet room and one to a room with music, then comparing test scores.
Additional info: These foundational concepts in data collection and experimental design are essential for understanding how to obtain reliable, unbiased data and how to draw valid conclusions in statistics.
