 Back
BackChapter 1: Data Collection – Structured Study Notes for Statistics
Study Guide - Smart Notes
 Tailored notes based on your materials, expanded with key definitions, examples, and context.
Chapter 1: Data Collection
1.1 Introduction to the Practice of Statistics
Statistics is the science of collecting, organizing, summarizing, and analyzing information to draw conclusions about populations based on samples. The process of statistics involves several key steps, each essential for making reliable inferences.
Population: The complete set of all observations or individuals of interest.
Sample: A subset of measurements selected from the population.
Variable: A measurable characteristic of an individual or observation.
Observation (or variate): An individual measurement of a variable.
The Process of Statistics:
Identify the research objective.
Collect information to answer the research question.
Organize and summarize the information.
Draw conclusions from the information.
Example: To determine the mean weight of Beef Steak tomatoes grown in Lubbock, TX, a sample is taken from one plant, and the weights are recorded and analyzed.
Descriptive statistics: Organizing and summarizing collected information.
Inferential statistics: Generalizing results from a sample to the population and measuring reliability.
Additional info: Inference in statistics always involves uncertainty, which is quantified using concepts such as margin of error.
Types of Data
Data can be classified based on how it is obtained and its nature.
Primary data: Collected directly from the field or laboratory.
Secondary data: Previously collected and published data.
Variables:
Qualitative (categorical) variables: Classify individuals based on attributes or characteristics.
Quantitative variables: Provide numerical measures; arithmetic operations are meaningful.
Discrete variable: Quantitative variable with a finite or countable number of values (e.g., number of children).
Continuous variable: Quantitative variable with an infinite number of possible values (e.g., weight, temperature).
Key distinction: If you count to get the value, it is discrete; if you measure, it is continuous.
1.2 Observational Studies; Simple Random Samples
There are different approaches to collecting data, each with its own strengths and limitations.
Census: A list of all individuals in a population with their characteristics. Provides complete information but is often costly and time-consuming.
Observational study: Measures characteristics of a population by studying individuals in a sample. Useful for determining associations but not causation.
Designed experiment: Applies treatments to experimental units and isolates the effects on a response variable. Required to establish causation.
Lurking variable: A variable not accounted for that may affect the response variable (e.g., diet or exercise in a smoking study).
Summary: Observational studies can determine associations, while designed experiments are needed to establish causation.
Simple Random Sampling
Simple random sampling ensures that every possible sample of a given size has an equal chance of being selected. This method is fundamental for unbiased statistical inference.
Random sample: Each individual in the population has an equal chance of being included.
Frame: A list of all individuals in the population.
Sampling without replacement: Once selected, an individual cannot be chosen again.
Methods for obtaining a simple random sample:
Using a table of random numbers.
Using technology (e.g., Excel).
Example: Selecting 5 clients from a list of 30 using a random number table or Excel.
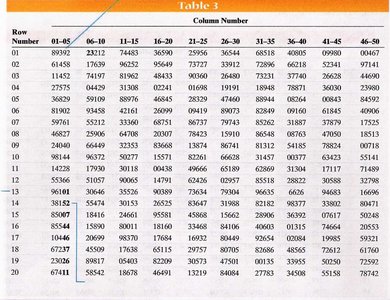
Additional info: Table 3 above is used to select random numbers corresponding to individuals in the population. Numbers greater than the population size are skipped.
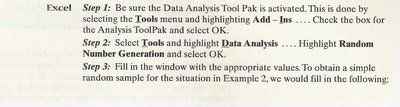
Using Excel for Random Sampling
Excel can be used to generate random samples efficiently by utilizing the Data Analysis ToolPak.
Activate the Data Analysis ToolPak via the Tools menu.
Select Data Analysis, then Random Number Generation.
Set parameters (e.g., number of variables, number of random numbers, range).
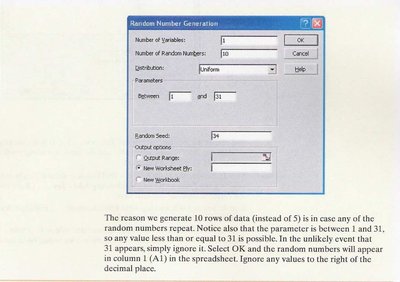
Additional info: Generating more random numbers than needed helps avoid duplicates. Ignore decimal places and values outside the population range.
1.3 Other Types of Sampling
Beyond simple random sampling, several probability sampling methods exist to address different research needs and population structures.
Stratified sample: Population is divided into non-overlapping groups (strata), and a simple random sample is taken from each. Individuals within strata should be similar.
Systematic sample: Select every kth individual from the population after a random start. Useful when a frame is available and population size is known.
Cluster sample: Select all individuals within randomly chosen groups (clusters). Efficient for large populations and reduces travel/cost.
Convenience sample: Individuals are easily obtained, often self-selected. Prone to bias and not representative.
Example of stratified sampling:
Category | Population | Proportion | Sample |
|---|---|---|---|
Resident students | 6,204 | 0.283 | 28 |
Non-resident students | 13,304 | 0.607 | 61 |
Faculty and staff | 2,401 | 0.110 | 11 |
Total | 21,909 | 1.000 | 100 |
Additional info: Stratified sampling improves accuracy and allows reporting by subgroup.
Systematic Sampling Steps
Determine population size (N).
Determine desired sample size (n).
Compute and round down.
Randomly select a number between 1 and k (call this p).
Sample consists of individuals at positions .
Cluster sampling: Used when population is naturally divided into groups. All individuals in selected clusters are surveyed.
Random vs. Non-Random Sampling
Random sampling: Reduces bias and increases representativeness.
Convenience sampling: Easier but may not represent the population accurately.
Key Point: The choice of sampling method affects the reliability and generalizability of statistical conclusions.
