 Back
Chapter 1: Data Collection – Structured Study Notes for Introductory Statistics
Study Guide - Smart Notes
 Tailored notes based on your materials, expanded with key definitions, examples, and context.
Data Collection in Statistics
Introduction to Statistics
Statistics is the scientific discipline concerned with the systematic collection, organization, presentation, analysis, and interpretation of data. It enables us to identify patterns, understand trends, and make informed decisions based on data from various fields such as science, business, healthcare, and social research.
Statistics: The science of learning from data.
Data: Information collected through experiments, surveys, or observations.
Statistical Thinking: Understanding variability and uncertainty in data.
Core Vocabulary of Statistics
Understanding key terms is essential for interpreting statistical studies and results.
Population: The entire group of individuals or objects of interest.
Sample: A subset of the population that is actually observed or studied.
Parameter: A numerical summary describing the population (usually unknown).
Statistic: A numerical summary describing the sample (used to estimate parameters).
Variable: Any characteristic observed on individuals in a data set.
Data: The values of variables collected from individuals.
The Process of Statistics
The statistical process involves four main steps:
Identify the research objective: Define the question and population to be studied.
Collect data: Obtain data from a sample or population using appropriate methods.
Describe the data: Use descriptive statistics to summarize and visualize data.
Perform inference: Apply inferential statistics to generalize results and assess reliability.
Types of Data and Variables
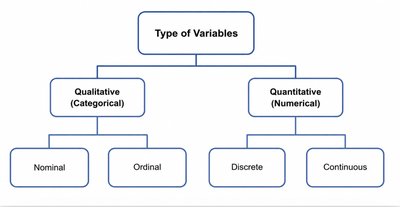
Qualitative vs. Quantitative Variables
Variables are classified based on the type of data they represent:
Qualitative (Categorical) Variables: Describe categories or groups (e.g., gender, payment method).
Quantitative (Numerical) Variables: Represent numerical values (e.g., height, amount paid).
Subtypes of Variables
Nominal: Categories with no meaningful order (e.g., dog breed, payment method).
Ordinal: Categories with a logical order (e.g., course grades, Likert scale).
Discrete: Numerical values with gaps (e.g., number of pets).
Continuous: Numerical values within an interval (e.g., height, amount paid).
Examples of Variables in Data
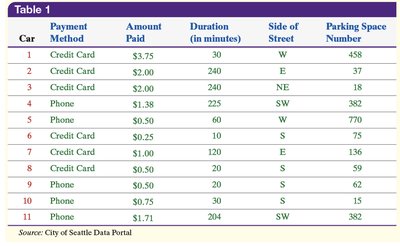
Consider a sample of on-street parking meters in Seattle:
Payment Method: Qualitative, nominal
Amount Paid: Quantitative, continuous
Side of Street: Qualitative, nominal
Parking Space Number: Qualitative, nominal
Populations, Samples, Parameters, and Statistics
Definitions and Examples
Population: All individuals of interest (e.g., all US males).
Sample: Subset observed (e.g., 100 randomly selected US males).
Parameter: Average height of all US males.
Statistic: Average height of the sample.
Example: If 48.2% of all students own a car, this is a parameter. If 46% of a sample of 100 students own a car, this is a statistic.
Types of Studies
Observational vs. Experimental Studies
Statistical studies are classified based on how data is collected:
Observational Study: Researchers observe subjects without intervention.
Experimental Study: Researchers manipulate variables and assign treatments.
Example: In a clinical trial, patients are randomly assigned to treatment or control groups. In an observational study, researchers record outcomes without assigning treatments.
Sampling Methods
Simple Random Sampling (SRS)
Every possible sample of size n from a population of size N has an equal chance of being selected. SRS can be done with or without replacement.
Other Effective Sampling Methods
Stratified Sampling: Divide population into homogeneous strata, sample from each stratum.
Systematic Sampling: Select every kth individual after a random start.
Cluster Sampling: Select entire groups (clusters) at random, sample all individuals within selected clusters.
Examples of Sampling Methods
Stratified Sampling: Surveying resident students, nonresident students, and staff at a university in proportion to their population sizes.
Systematic Sampling: Surveying every 7th customer exiting a store.
Cluster Sampling: Surveying all households in randomly selected city blocks.
Bias in Sampling
Types of Bias
Sampling Bias: Technique favors one part of the population.
Convenience Sample: Individuals easily accessible are more likely to be included.
Undercoverage: Some segments of the population are underrepresented.
How to Reduce Bias
Always look for bias and report sampling methods in detail.
Pilot-test surveys to identify misunderstandings.
Refine surveys based on pilot results.
Summary Table: Seattle Parking Meter Data
The following table illustrates the classification of variables in a real-world data set:
Car | Payment Method | Amount Paid | Duration (in minutes) | Side of Street | Parking Space Number |
|---|---|---|---|---|---|
1 | Credit Card | $3.75 | 30 | W | 458 |
2 | Credit Card | $2.00 | 240 | E | 37 |
3 | Credit Card | $2.00 | 240 | NE | 18 |
4 | Phone | $1.38 | 225 | SW | 382 |
5 | Phone | $0.50 | 60 | S | 75 |
6 | Credit Card | $0.25 | 10 | S | 75 |
7 | Credit Card | $1.00 | 120 | S | 71 |
8 | Phone | $0.50 | 20 | S | 69 |
9 | Phone | $0.75 | 30 | S | 15 |
10 | Phone | $1.71 | 204 | SW | 382 |
Purpose: This table is used to illustrate the classification of variables and the structure of real-world data.
Key Takeaways
Distinguish between parameters and statistics.
Identify different types of variables and their possible values.
Differentiate between experimental and observational studies.
Understand effective sampling methods and how to reduce bias.
