 Back
Chapter 1: Introduction to Statistics and Data
Study Guide - Smart Notes
 Tailored notes based on your materials, expanded with key definitions, examples, and context.
Stats Starts Here
Introduction to Statistics
Statistics is a discipline that enables us to make sense of data and variation in the world. It is not just about numbers, but about reasoning, making decisions, and understanding information in context. Learning statistics helps us see the world more clearly and make informed decisions.
Statistics (noun): Refers to numbers, values, and calculations derived from data.
Statistics (verb): Refers to the reasoning, tools, and methods used to interpret data and understand the world.
Data: Objects with context; can be numbers, characters, images, or other labels.
What Is Statistics Really About?
Variation and Decision Making
Statistics is fundamentally about variation—measuring, understanding, and adapting to it. It also involves making decisions when information is incomplete.
Measuring variation: Quantifying differences and changes in data.
Understanding variation: Identifying sources and patterns of variability.
Reducing/adapting to variation: Using statistical methods to minimize or account for variability.
Decision making: Drawing conclusions from data, often with uncertainty.
Data
What Are Data?
Data are the foundation of statistics. They can take many forms, including numbers, text, images, or other labels. The meaning of data depends on its context.
Numerical data: Numbers with meaningful units (e.g., height in inches).
Categorical data: Labels or categories (e.g., gender, eye color).
Context: Essential for interpreting data; without context, data are meaningless.
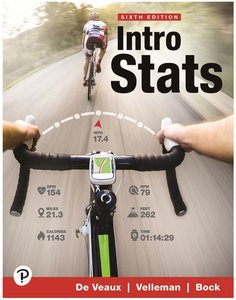
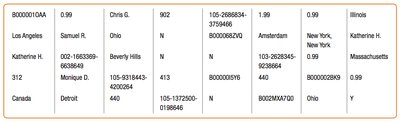
Raw Data vs. Data in Context
Raw data are unorganized and lack meaning. When data are organized, labeled, and contextualized, they become informative.
Raw data: Unprocessed, often difficult to interpret.
Data in context: Organized and labeled, providing meaningful information.
Challenges with Real Data
Real-world data can be messy, with different units, ambiguous questions, non-responses, and outliers. Careful planning and clear definitions are crucial for meaningful data collection.
Different units: Data may be measured in various units, complicating analysis.
Ambiguous questions: Lead to unclear or inconsistent responses.
Non-response: Missing data must be handled appropriately.
Outliers: Unusual or "ridiculous" responses require careful consideration.
Sample and Population
Understanding Samples and Populations
Statistics aims to describe populations, but often relies on samples due to practicality. Samples must be representative, and randomness is used to ensure this.
Population: The entire group of interest.
Sample: A subset of the population used to make inferences.
Randomness: Helps select representative samples.
The "W's" of Data
Providing Context with the W's
To fully understand data, we must answer the "W's": Who, What, When, Where, Why, and How. The "Who" and "What" are essential for context.
Who: Individuals being measured.
What: Variables measured and their units.
When, Where, Why, How: Additional context for interpretation.

Variables
Types of Variables
Variables are characteristics measured in a study. They are classified as categorical or quantitative.
Categorical (Qualitative) Variables: Values are descriptors or categories (e.g., gender, eye color).
Ordinal Data: Categorical data with inherent order (e.g., class rank).
Identifier Data: Unique categorical values for each observation (e.g., Social Security Number).
Quantitative Variables: Values are numbers, usually with units (e.g., height, income).
Examples of Variables
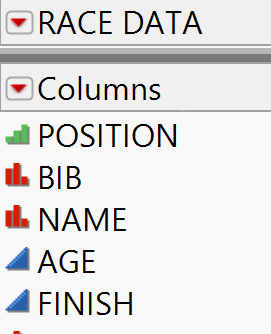
Variables can be presented as both numerical and categorical, depending on context. Statistical software often indicates variable type, but context is key.
Gender: Categorical
Number of siblings: Quantitative
Height: Quantitative
Favorite coffee flavor: Categorical
Shoe size: Quantitative
Identifier Variables
Identifier variables are categorical variables with unique values for each observation. They are not summarized graphically or numerically, but are used for identification.
Examples: Social Security Number, ISBN, Tracking Number
Purpose: To uniquely identify individuals or items
Types of Data Exercises
Practice identifying variable types in real-world examples.
Gender: Categorical
Number of siblings: Quantitative
Number of countries visited: Quantitative
Height: Quantitative
Favorite Starbucks flavor: Categorical
Shoe size: Quantitative
Randomness
Understanding Random Events
Random events are those where possible outcomes are known, but individual outcomes cannot be predicted. Independence means past events do not affect future events.
Randomness: Events are unpredictable and independent.
Equally likely: Not all random events are equally likely.
Generating Random Values
Statisticians use computer algorithms to generate random numbers, which are essential for simulations and sampling.
Random number generation: Used in simulations and sampling.
Simulation: Mimics reality using random numbers to represent outcomes.
Applications of Randomness
Simulations are used when exact answers are too complex or impossible to determine. Examples include economic modeling, weather simulations, and virtual reality environments.
Economic modeling: Simulating job creation or termination due to interest rate changes.
Weather and aviation: Simulating aircraft landings under various conditions.
Virtual reality: Creating realistic environments using random events.
Tables
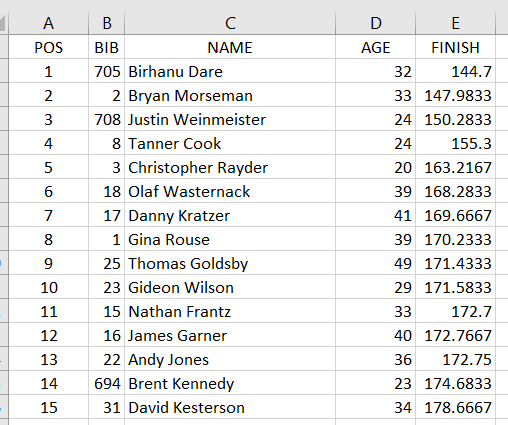
Race Data Table
This table provides an example of quantitative and categorical variables in a race context.
POS | BIB | NAME | AGE | FINISH |
|---|---|---|---|---|
1 | 705 | Birhanu Dare | 32 | 144.7 |
2 | 2 | Bryan Morseman | 33 | 147.9833 |
3 | 708 | Justin Weinmeister | 24 | 150.2833 |
4 | 8 | Tanner Cook | 24 | 155.3 |
5 | 3 | Christopher Rayder | 20 | 163.2167 |
6 | 18 | Olaf Wasternack | 41 | 169.6667 |
7 | 17 | Danny Kratzer | 39 | 170.2333 |
8 | 25 | Thomas Goldsby | 49 | 171.4333 |
9 | 23 | Gideon Wilson | 29 | 171.5833 |
10 | 15 | Nathan Frantz | 33 | 172.7 |
11 | 16 | James Garner | 40 | 172.7667 |
12 | 13 | Andy Jones | 36 | 172.75 |
13 | 694 | Brent Kennedy | 23 | 174.6833 |
14 | 31 | David Kesterson | 34 | 178.6667 |
Additional info: This table demonstrates the use of both categorical (NAME, BIB) and quantitative (AGE, FINISH) variables in a real dataset.
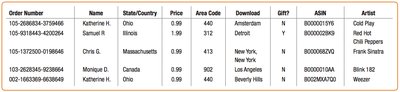
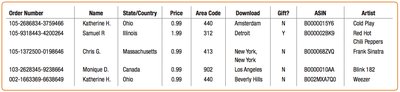
Order Data Table
This table illustrates categorical and quantitative variables in a business context.
Order Number | Name | State/Country | Price | Area Code | Download | Gift? | ASIN | Artist |
|---|---|---|---|---|---|---|---|---|
105-2686884-3794066 | Katherine K. | Ohio | 0.99 | 440 | Amsterdam | N | B0000035Y6 | Cold Play |
105-9318443-4200264 | Samuel R. | Illinois | 0.99 | 902 | Detroit | N | B0000035Y6 | Red Hot Chili Peppers |
105-1372500-0189466 | Chris G. | Massachusetts | 0.99 | 413 | New York | N | B0000035Y6 | Frank Sinatra |
103-2628345-9328684 | Monique D. | Canada | 0.99 | 902 | Los Angeles | N | B0000035Y6 | Blink 182 |
002-1653899-6589680 | Katherine H. | Ohio | 0.99 | 440 | Beverly Hills | Y | B002KM7A00 | Weezer |
Additional info: This table shows how categorical (Name, State/Country, Download, Artist) and quantitative (Price, Area Code) variables are used in business analytics.
