 Back
BackChapter 1: Introduction to Statistics – Key Concepts and Methods
Study Guide - Smart Notes
 Tailored notes based on your materials, expanded with key definitions, examples, and context.
Introduction to Statistics
What is Statistics?
Statistics is the science of planning studies and experiments; obtaining data; and organizing, summarizing, presenting, analyzing, and interpreting those data to draw conclusions. It is widely used in everyday life, from social media analytics to consumer ratings and academic performance metrics.
Examples: Average number of likes on social media, GPA calculation, traffic analysis, consumer ratings.
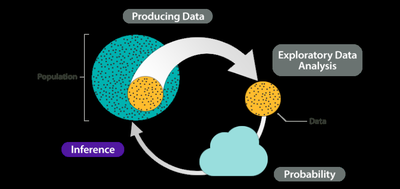
The Statistical Study Process
Conducting a statistical study involves three main phases:
Prepare: Define context, identify data sources, and choose an appropriate sampling method.
Analyze: Graph and explore data, summarize with statistics (mean, standard deviation), check for outliers and missing data, and apply statistical methods.
Conclude: Assess statistical and practical significance of results.
Types of Statistics
Descriptive vs. Inferential Statistics
Descriptive Statistics: Methods for organizing and summarizing information in a data set (e.g., graphs, tables, numerical measures).
Inferential Statistics: Methods for estimating and drawing conclusions about population characteristics based on sample data, using probability statements.
Key Terms:
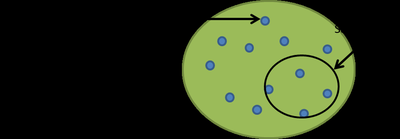
Population: The complete collection of all measurements or data being considered.
Census: Data from every member of the population.
Sample: A subcollection of members selected from a population.
Parameter: Numerical measurement describing a population characteristic (e.g., population mean ).
Statistic: Numerical measurement describing a sample characteristic (e.g., sample mean ).
Types of Data and Variables
Variables and Data
Variable: A characteristic of an individual that can be measured or observed.
Data: Values that variables can attain.
Observation: Each individual piece of data.
Dataset: Collection of all observations for a variable.
Types of Variables
Categorical (Qualitative): Non-numeric values, separated into categories (e.g., gender, eye color).
Quantitative (Numerical): Numeric values (e.g., weight, height).
Discrete: Countable values (e.g., number of siblings).
Continuous: Values within an interval (e.g., weight, height).
Levels of Measurement
Nominal: Names, labels, or categories without order (e.g., colors, survey responses).
Ordinal: Ordered categories, but differences are not meaningful (e.g., grades, rankings).
Interval: Ordered, meaningful differences, but no true zero (e.g., temperature, years).
Ratio: Ordered, meaningful differences, and a true zero (e.g., weight, prices).
Big Data and Data Science
Big Data: Extremely large and complex datasets requiring advanced computational tools.
Data Science: Application of statistics, computer science, and domain knowledge to analyze data.
Collecting Sample Data
Why Sample?
Sampling is often necessary due to time, cost, or feasibility constraints.
Advantages: Lower cost, faster data collection, improved accuracy and quality.
Types of Studies
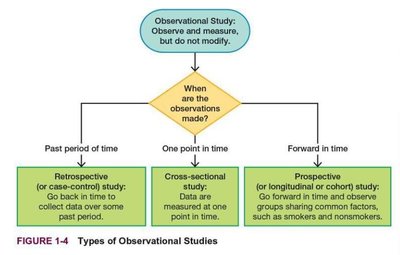
Observational Study: Observe and measure characteristics without intervention.
Experimental Study: Researchers impose treatments and observe responses.
Types of Observational Studies
Retrospective: Looks back at past data.
Cross-sectional: Data measured at one point in time.
Prospective: Follows subjects forward in time.
Confounding Variables
Confounding occurs when the effects of different factors cannot be distinguished.
Confounding variables can lead to mistaken conclusions.
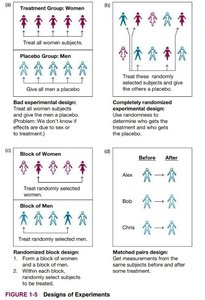
Design of Experiments
Key Principles
Replication: Repeating the experiment on multiple subjects.
Blinding: Subjects do not know if they receive treatment or placebo.
Randomization: Assigning subjects to groups by chance.
Sampling Methods
Basic Sampling Methods
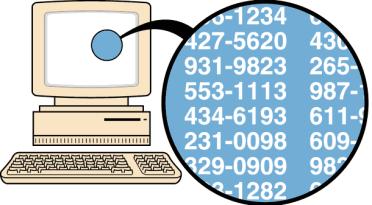
Simple Random Sampling: Every possible sample of size n has the same chance of being chosen.
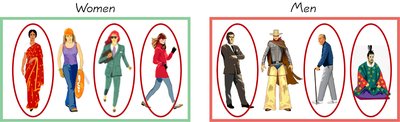
Stratified Sampling: Divide population into subgroups (strata) and sample from each.
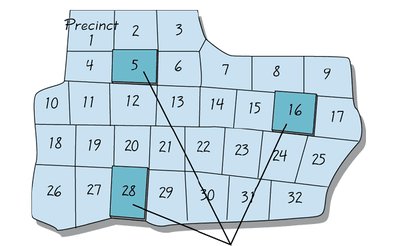
Cluster Sampling: Divide population into clusters, randomly select clusters, and sample all members in selected clusters.
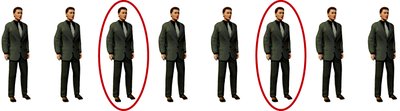
Systematic Sampling: Select every kth element from a list after a random start.
Convenience Sampling: Use data from subjects that are easy to access.
Voluntary Response Sampling: Subjects choose to participate (often biased).
Multi-Stage Sampling: Combines several sampling methods in stages.
Sampling Errors
Sampling Error: Random error due to chance sample fluctuations.
Nonsampling Error: Human errors, such as data entry mistakes or biased questions.
Nonrandom Sampling Error: Errors from using nonrandom sampling methods.

Summary Table: Types of Variables and Levels of Measurement
Variable | Type | Level of Measurement |
|---|---|---|
Model | Qualitative | Nominal |
Color | Qualitative | Nominal |
Level of Damage | Qualitative | Ordinal |
Weight | Quantitative (Continuous) | Ratio |
Number of Cylinders | Quantitative (Discrete) | Ratio |
Key Formulas
Population Mean:
Sample Mean:
Population Proportion:
Sample Proportion:
Additional info: These notes are based on "Elementary Statistics" by Mario Triola and Neil A. Weiss, and are designed to provide a comprehensive overview of introductory statistics concepts for college students.
