 Back
BackChapter 1: Introduction to Statistics - Structured Study Notes
Study Guide - Smart Notes
 Tailored notes based on your materials, expanded with key definitions, examples, and context.
Introduction to Statistics
Statistical and Critical Thinking
Statistics is the science of collecting, organizing, analyzing, and interpreting data to make informed decisions. Statistical thinking involves not only performing calculations but also applying critical thinking to understand the context, source, and methods used in data collection and analysis.
Statistics: The science of planning studies and experiments; obtaining data; and organizing, summarizing, presenting, analyzing, and interpreting those data to draw conclusions.
Statistical Thinking: Requires critical thinking and common sense, not just computational skills.
Key Process: Conducting a statistical study involves three main steps: prepare, analyze, and conclude.
Types of Data
Data are collections of observations, such as measurements, genders, or survey responses. Understanding the types of data is fundamental to statistical analysis.
Data: Collections of observations (e.g., measurements, survey responses).
Population: The complete collection of all measurements or data being considered. It is the group about which we want to make inferences.
Census: Collection of data from every member of a population.
Sample: A subcollection of members selected from a population.
Example: In a survey of 410 human resource professionals, 148 said job candidates were disqualified due to social media postings. Here, the population is all human resource professionals, and the sample is the 410 surveyed.
Collecting Sample Data
Proper data collection is essential for reliable statistical analysis. The method of sampling can greatly affect the validity of conclusions.
Random Sampling: Individuals are randomly selected, which helps ensure unbiased results.
Voluntary Response Sample: Respondents decide whether to participate. This method is prone to bias and should not be used to make conclusions about a population.
Examples of Voluntary Response Samples:
Internet polls
Mail-in polls
Telephone call-in polls
Example: A television poll with 186,000 volunteer respondents showed 67% wanted the UN moved out of the US, while a random sample of 500 showed only 38%. The random sample is more reliable due to superior sampling methods.
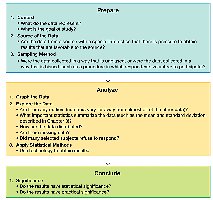
Statistical Study Process: Prepare, Analyze, Conclude
The process of conducting a statistical study is structured into three main phases:
Prepare: Consider the context, source of data, and sampling method.
Analyze: Begin with graphs and exploration, then apply statistical methods.
Conclude: Distinguish between statistical significance and practical significance.
Statistical Significance vs. Practical Significance
Statistical significance refers to the likelihood that an event is not due to chance, while practical significance considers whether the result is meaningful in real-world terms.
Statistical Significance: Achieved if the likelihood of an event occurring by chance is 5% or less.
Practical Significance: Even if a result is statistically significant, it may not be large enough to be meaningful or useful in practice.
Example: A weight loss program shows a statistically significant average loss of 2.1 kg after one year, but many dieters may not find this loss practically significant.
Potential Pitfalls in Analyzing Data
Several pitfalls can affect the reliability and interpretation of statistical results:
Misleading Conclusions: Conclusions should be clear and understandable to all audiences.
Sample Data Reported Instead of Measured: Direct measurement is preferable to self-reported data.
Loaded Questions: Poorly worded survey questions can bias results.
Order of Questions: The sequence of questions can unintentionally influence responses.
Nonresponse: Occurs when individuals refuse or are unavailable to respond, leading to potential bias.
Low Response Rates: Decrease reliability and increase bias.
Misleading Percentages: Percentages exceeding 100% are often unjustified and misleading.
Summary Table: Census vs. Sample
Term | Definition | Example |
|---|---|---|
Census | Collection of data from every member of a population | Surveying all human resource professionals |
Sample | Subcollection of members selected from a population | Surveying 410 human resource professionals |
Key Formulas
Statistical Significance: Typically, a result is statistically significant if .
Additional info: The notes expand on the importance of sampling methods, the distinction between statistical and practical significance, and common pitfalls in data analysis, providing context for students new to statistics.
