 Back
BackChapter 1: Introduction to Statistics – Structured Study Notes
Study Guide - Smart Notes
 Tailored notes based on your materials, expanded with key definitions, examples, and context.
Section 1.1 – Statistical & Critical Thinking
Introduction to Statistics
Statistics is the science of collecting, organizing, analyzing, and interpreting data in order to draw conclusions about a population based on a sample. The goal of statistics is to learn about a large group (population) by examining data from a smaller group (sample).
Population: The complete collection of all individuals to be studied.
Sample: A subcollection of members selected from a population.
Data: Observations that have been collected, such as measurements or survey responses.
Example: To estimate the proportion of people who will have a severe reaction to the flu shot, we use a sample rather than testing the entire population.
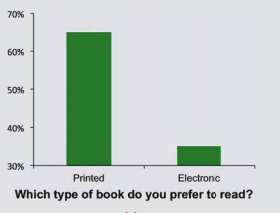
Application: Surveys and studies use samples to make inferences about populations, such as traffic fatality rates or book preferences.
Definition of Statistics
Statistics: The science of collecting, organizing, analyzing, and interpreting data to draw conclusions.
Terminology
Census: The collection of data from every member of the population.
Sample: A subset of the population selected for study.
Example: The U.S. Department of Energy surveys 1000 gasoline stations to estimate the average price per gallon. The population is all U.S. gas stations; the sample is the 1000 surveyed stations.
Process of a Statistical Study
Prepare: Consider the context, source, and sampling method.
Analyze: Graph data, look for outliers, examine distribution, and apply statistical methods.
Conclude: Determine statistical and practical significance.
Statistical Significance: Achieved when a result is very unlikely to occur by chance. Practical Significance: Occurs when sample data leads to a meaningful and useful conclusion.
Critical Thinking – Analyzing Data
Critical thinking in statistics involves distinguishing between valid and flawed conclusions. Data can be distorted in several ways:
Misleading Conclusions: Correlation does not imply causation.
Sample Data Reported Instead of Measured: Biased samples cannot be used to make valid conclusions.
Loaded Questions: Questions worded to elicit a desired response.
Distorted Percentages: Misleading or unclear percentages can distort interpretation.
Key Principles for Percentages:
Percentage means "per 100".
To find a percentage of a number: multiply the number by the percentage (as a decimal).
To convert a fraction to a percentage: divide, then multiply by 100.
To convert a decimal to a percentage: multiply by 100.
To convert a percentage to a decimal: divide by 100.
Section 1.2 – Types of Data
Types of Data
The type of data determines the statistical methods used in analysis.
Parameter: A numerical measurement describing a characteristic of a population.
Statistic: A numerical measurement describing a characteristic of a sample.
Quantitative Data: Consists of numbers representing counts or measurements (e.g., age, weight).
Categorical (Qualitative) Data: Consists of names or labels (e.g., gender, types of movies).
Discrete Data: Data values are countable (e.g., number of students).
Continuous Data: Data values are infinitely many and measurable (e.g., time, weight).
Levels of Measurement
Levels of measurement indicate the type of statistical analysis that is appropriate.
Nominal: Data consists of names, labels, or categories only. No order or ranking.
Ordinal: Data can be arranged in order, but differences between values are not meaningful.
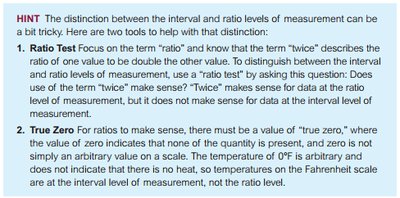
Interval: Data can be ordered, and differences are meaningful, but there is no natural zero.
Ratio: Data can be ordered, differences are meaningful, and there is a natural zero. Ratios are meaningful.
Example:
Nominal: Types of movies (drama, comedy, etc.)
Ordinal: Ranks of cars
Interval: Body temperatures in degrees Fahrenheit
Ratio: Depths of earthquakes
Section 1.3 – Collecting Sample Data
Basics of Collecting Data
Data is typically obtained from two sources:
Observational Study: Observes and measures characteristics without influencing subjects.
Experiment: Applies treatment and observes effects on subjects.
Sampling Techniques
Sampling methods are used to select representative samples from populations.
Simple Random Sample: Every member of the population has an equal chance of being selected.
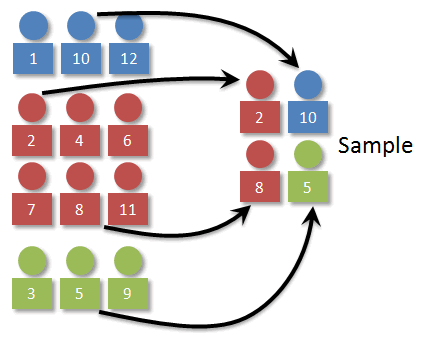
Stratified Sampling: Population is divided into subgroups (strata), and random samples are taken from each stratum.
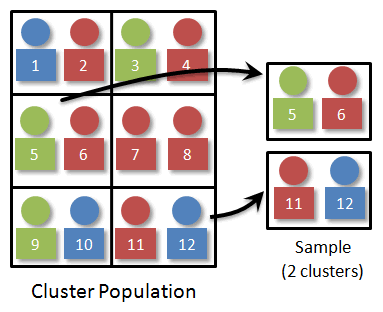
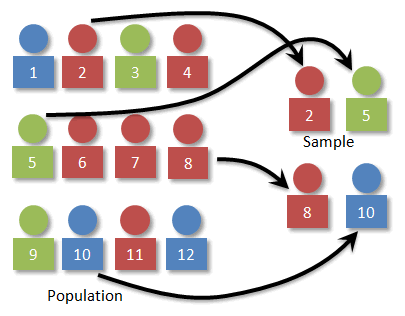
Cluster Sampling: Population is divided into clusters, some clusters are randomly selected, and all members of selected clusters are sampled.
Convenience Sampling: Samples are selected based on ease of access.
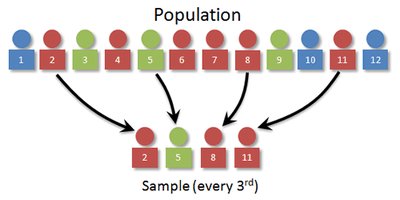
Systematic Sampling: Every nth member of the population is selected.
Types of Observational Studies
Cross-Sectional: Data are observed at one point in time.
Retrospective: Data are collected from the past.
Prospective: Data are collected in the future from groups sharing common factors.
Design of Experiments
Three important considerations when designing experiments:
Randomization: Assign subjects to groups randomly.
Replication: Repeat the experiment on enough subjects to recognize effects.
Control: Control variables using techniques such as blinding and randomization.
Additional info: Academic context and examples have been expanded for clarity and completeness.
