 Back
BackChapter 1: Introduction to Statistics – Structured Study Notes
Study Guide - Smart Notes
 Tailored notes based on your materials, expanded with key definitions, examples, and context.
Introduction to Statistics
Statistical and Critical Thinking
Statistics is the science of planning studies and experiments, obtaining data, and organizing, summarizing, presenting, analyzing, and interpreting those data to draw conclusions. Statistical thinking involves critical thinking and the ability to make sense of results, demanding more than just computational skills.
Key Point: The statistical process consists of three main steps: Prepare, Analyze, and Conclude.
Prepare: Consider the context, source, and sampling method before collecting data.
Analyze: Use graphs and statistical methods to explore and interpret data.
Conclude: Distinguish between statistical significance and practical significance when interpreting results.
Statistical Significance: Achieved if the likelihood of an event occurring by chance is 5% or less.
Practical Significance: Even if a result is statistically significant, it may not be meaningful in practice.
Potential Pitfalls: Misleading conclusions, loaded questions, nonresponse, and misuse of percentages can affect data analysis.
Definitions and Key Terms
Data: Collections of observations, such as measurements, genders, or survey responses.
Population: The complete collection of all measurements or data being considered.
Sample: A subcollection of members selected from a population.
Parameter: A numerical measurement describing some characteristic of a population.
Statistic: A numerical measurement describing some characteristic of a sample.
Types of Data
Data can be classified as quantitative or categorical, and further described by levels of measurement.
Quantitative (Numerical) Data: Numbers representing counts or measurements (e.g., weights, ages).
Categorical (Qualitative) Data: Names or labels (e.g., gender, shirt numbers).
Discrete Data: Quantitative data with a finite or countable number of values (e.g., number of coin tosses).
Continuous Data: Quantitative data with infinitely many possible values (not explicitly listed in the notes, but implied).
Levels of Measurement
Data can be classified into four levels of measurement, which determine the statistical methods used:
Nominal: Categories only (e.g., survey responses: yes, no, undecided).
Ordinal: Categories with some order (e.g., course grades: A, B, C, D, F).
Interval: Differences are meaningful, but no natural zero (e.g., years, GPA, SAT scores).
Ratio: Differences and ratios are meaningful, with a natural zero (e.g., class times, lengths).
Summary Table – Levels of Measurement:
Level | Description | Examples |
|---|---|---|
Nominal | Categories only | Gender, survey responses |
Ordinal | Categories with order | Course grades |
Interval | Meaningful differences, no natural zero | Years, GPA |
Ratio | Meaningful differences and ratios, natural zero | Lengths, times |
Collecting Sample Data
Proper collection of sample data is essential for valid statistical analysis. Several sampling methods are used to obtain representative samples:
Simple Random Sample: Every possible sample of the same size has the same chance of being chosen.
Systematic Sampling: Select a starting point and then every kth element.
Convenience Sampling: Collect data that is easy to obtain.
Stratified Sampling: Subdivide population into subgroups and sample from each.
Cluster Sampling: Divide population into clusters, randomly select clusters, and sample all members from selected clusters.
Multistage Sampling: Combine several sampling methods in stages.
Experiments and Observational Studies
Data can be collected through experiments or observational studies. Experiments involve applying treatments and observing effects, while observational studies involve measuring characteristics without intervention.
Experiment: Apply treatment and observe effects on subjects (experimental units).
Observational Study: Observe and measure characteristics without modifying subjects.
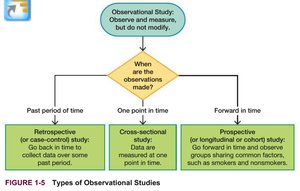
Types of Observational Studies:
Cross-sectional Study: Data observed at one point in time.
Retrospective (Case-Control) Study: Data collected from a past period.
Prospective (Cohort) Study: Data collected in the future from groups sharing common factors.
Design of Experiments
Experimental design is crucial for controlling variables and ensuring valid results. Several designs are used to minimize bias and confounding:
Replication: Repetition of an experiment on multiple subjects.
Blinding: Subjects do not know if they receive treatment or placebo.
Double-Blind: Both subjects and experimenters are unaware of treatment assignments.
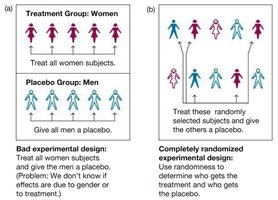
Randomization: Subjects assigned to groups by random selection.

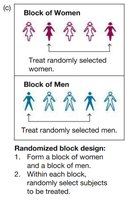
Randomized Block Design
Subjects are grouped into blocks based on similar characteristics, and treatments are randomly assigned within each block.
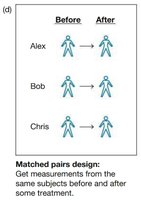
Matched Pairs Design
Subjects are matched in pairs based on similarity, and each pair receives different treatments for comparison.
Handling Missing Data
Missing data can occur randomly or not at random. Methods for handling missing data include deleting cases, imputing values, or ignoring missing values depending on context.
Sampling Errors
Sampling errors are inevitable, even with well-planned methods. Types of errors include:
Sampling Error: Discrepancy between sample result and true population result due to chance.
Nonsampling Error: Human errors such as wrong data entries, biased questions, or inappropriate methods.
Nonrandom Sampling Error: Errors from using nonrandom sampling methods (e.g., convenience or voluntary response samples).
Big Data and Data Science
Big data refers to large and complex data sets requiring advanced software and parallel computing. Data science combines statistics, computer science, and other fields to analyze big data.
Summary
Statistics is essential for making informed decisions based on data.
Proper data collection, classification, and analysis are fundamental to valid statistical conclusions.
Understanding types of data, levels of measurement, sampling methods, and experimental design is crucial for statistical literacy.
