 Back
BackChapter 1: Introduction to Statistics – Structured Study Notes
Study Guide - Smart Notes
 Tailored notes based on your materials, expanded with key definitions, examples, and context.
Introduction to Statistics
Key Concepts in Statistical Studies
Statistics is the science of planning studies and experiments, obtaining data, and organizing, summarizing, presenting, analyzing, and interpreting those data to draw meaningful conclusions. The process of conducting a statistical study consists of three main stages: prepare, analyze, and conclude. Statistical thinking requires critical evaluation of results, not just computational skills.
Prepare: Define context, identify reputable sources, and select unbiased sampling methods.
Analyze: Use appropriate graphs and statistical methods to explore data.
Conclude: Assess statistical and practical significance of findings.
Statistics can be misleading if not properly understood or applied. It is essential to critically evaluate the validity and meaning of statistical statements.
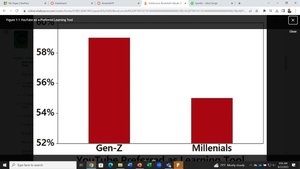
Misleading Graphs and Data Representation
Graphs can be constructed in ways that mislead viewers, either intentionally or unintentionally. Proper graph selection and construction are crucial for accurate data representation.
Bad graphs: Can distort the interpretation of data.
Bad sampling: No statistical analysis can correct for poor sampling.
Bad analysis: Use appropriate models and methods.
Missing data: Address missing values through imputation or removal.

Definitions and Fundamental Terms
Understanding basic terminology is essential for statistical studies.
Data: Collections of observations (measurements, survey responses).
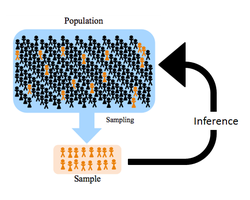
Population: The complete collection of all data being considered.
Census: Data from every member of the population.
Sample: A subcollection selected from the population.
Example: In a survey of 410 human resource professionals, the population is all HR professionals, and the sample is the 410 surveyed.
Critical Thinking in Statistical Data
Statistical studies require careful consideration of context, data sources, and sampling methods. The three-stage process ensures comprehensive analysis:
Context: Define goals and objectives.
Source: Assess the reputation and potential bias of data sources.
Sampling Method: Ensure unbiased and random sampling.
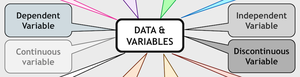
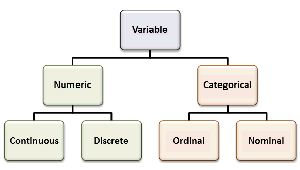
Types of Data
Identifying the type of data is crucial for selecting appropriate analysis techniques. Data can be classified as quantitative or qualitative, and further as discrete or continuous.
Quantitative Data: Numerical values that can be counted or measured.
Qualitative (Categorical) Data: Distinct categories based on characteristics.
Discrete Data: Countable values (e.g., number of coin tosses).
Continuous Data: Measurable values with infinite possibilities (e.g., height).
Levels of Measurement
Data can be measured at different levels, which determine the types of statistical analysis that can be performed:
Nominal: Categories only, no order (e.g., eye color).
Ordinal: Ordered categories, differences not meaningful (e.g., ranks).
Interval: Meaningful differences, no true zero (e.g., temperature in Celsius).
Ratio: Meaningful differences and ratios, true zero exists (e.g., height).
Big Data and Data Science
Big data refers to extremely large and complex data sets that require advanced computational tools for analysis. Data science integrates statistics, computer science, and other fields to analyze and interpret big data.
Handling Missing Data
Missing data can occur randomly or due to specific reasons. Common methods for addressing missing data include:
Delete Cases: Remove subjects with missing values.
Impute Missing Values: Substitute missing values with estimated ones.
Collecting Sample Data
Sampling Methods and Errors
Proper sampling is essential for meaningful statistical analysis. The simple random sample is the gold standard, ensuring every member of the population has an equal chance of selection. Other sampling methods include:
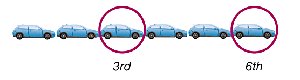
Systematic Sampling: Select every kth element from a starting point.
Convenience Sampling: Use easily accessible data.
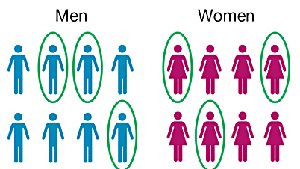
Stratified Sampling: Divide population into subgroups and sample from each.
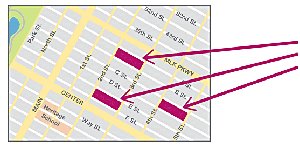
Cluster Sampling: Divide population into clusters, randomly select clusters, and sample all members within.
Multistage Sampling: Combine multiple sampling methods in stages.

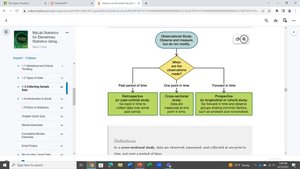
Observational vs. Experimental Studies
Data can be collected through observational or experimental studies:
Observational Study: Observe and measure characteristics without intervention.
Experimental Study: Apply treatment and observe effects.
Design of Experiments
Good experimental design incorporates randomness, replication, and blinding:
Randomness: Assign subjects to groups randomly.
Replication: Repeat experiment on multiple subjects.
Blinding: Subjects (and sometimes researchers) do not know group assignments.
Double-blind: Both subjects and researchers are unaware of group assignments.
Sampling Errors
Sampling errors can occur even with random methods due to chance fluctuations. Nonsampling errors result from human mistakes, biased questions, or inappropriate methods. Nonrandom sampling errors arise from using nonrandom methods such as convenience or voluntary response samples.
Summary Table: Types of Sampling Methods
Sampling Method | Description | Example |
|---|---|---|
Simple Random | Every sample has equal chance | Randomly select subscribers |
Systematic | Select every kth item | Every 10th bottle checked |
Convenience | Easy to access data | Surveying only nearby people |
Stratified | Sample from subgroups | Randomly select from gender groups |
Cluster | Sample all members in selected clusters | Choose one hospital and survey all |
Multistage | Combination of methods | Pollsters use different methods in stages |
Summary Table: Levels of Measurement
Level | Description | Example |
|---|---|---|
Nominal | Categories only | Eye color |
Ordinal | Ordered categories | College ranks |
Interval | Meaningful differences, no true zero | Temperature (Celsius) |
Ratio | True zero, ratios meaningful | Height, weight |
Key Formulas
Sample Mean:
Population Mean:
Sample Proportion:
Conclusion
Understanding the fundamentals of statistics, including types of data, sampling methods, and levels of measurement, is essential for conducting meaningful statistical studies. Proper design, collection, and analysis of data ensure valid and reliable results.
