 Back
BackChapter 1: Introduction to Statistics – Study Notes
Study Guide - Smart Notes
 Tailored notes based on your materials, expanded with key definitions, examples, and context.
Introduction to Statistics
Section 1.1: An Overview of Statistics
Statistics is the foundational science of collecting, organizing, analyzing, and interpreting data to make informed decisions. This section introduces the essential concepts and terminology that underpin all statistical reasoning and practice.
Definition of Statistics
Statistics is the science of collecting, organizing, analyzing, and interpreting data to make decisions.
Data consists of information obtained from observations, counts, measurements, or responses.
Understanding statistics helps individuals become informed consumers, interpret statistical studies, and develop critical thinking skills.
Example: "Most U.S. adults today say they use the internet (95%), have a smartphone (90%), or subscribe to high-speed internet at home (80%)." (Source: Pew Research Center)
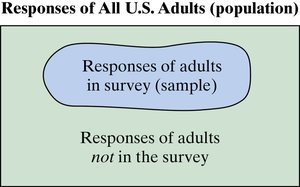
Populations and Samples
In statistics, it is crucial to distinguish between the entire group of interest (population) and the subset actually studied (sample).
Population: The collection of all outcomes, responses, measurements, or counts that are of interest.
Sample: A subset, or part, of the population.
Example: In a survey of 1152 adults in the United States, the population is all U.S. adults, while the sample is the 1152 surveyed individuals.

Parameters and Statistics
Statistical analysis often involves distinguishing between values that describe populations and those that describe samples.
Parameter: A numerical description of a population characteristic.
Statistic: A numerical description of a sample characteristic.
Study Tip: Remember: population parameter and sample statistic (matching first letters).
Example 1: If the average weekly grocery spend is based on a survey of 2798 households, it is a sample statistic.
Example 2: If the average SAT math score is calculated for the entire freshman class, it is a population parameter.
Example 3: If 34% of randomly checked stores fail to store fish properly, this percentage is a sample statistic.
Branches of Statistics
Statistics is divided into two main branches, each with distinct purposes and methods.
Descriptive Statistics: Involves the organization, summarization, and display of data using tables, charts, and averages.
Inferential Statistics: Involves using sample data to draw conclusions or make inferences about a population.
Descriptive vs. Inferential Statistics: Examples
Example 1: A study of 1000 U.S. adults who relocated found the average cost to move locally is $1692, and long distance is $4401. The averages are descriptive statistics; inferring that long-distance moves cost at least 2.5 times more is inferential.
Example 2: In a study of 1541 U.S. workers, 39% worry about disclosing a mental health condition to their employer. The percentage is descriptive; inferring that nearly two in five U.S. workers share this concern is inferential.
Summary Table: Key Terms
Term | Definition | Example |
|---|---|---|
Population | All individuals or items of interest | All U.S. adults |
Sample | Subset of the population | 1152 surveyed adults |
Parameter | Numerical summary of a population | Average SAT score of all freshmen |
Statistic | Numerical summary of a sample | Average grocery spend from a survey |
Descriptive Statistics | Summarizes data | Mean, median, charts |
Inferential Statistics | Makes predictions or inferences | Estimating population mean from sample |
Key Formulas
Sample Mean:
Population Mean:
Additional info: These foundational concepts are essential for understanding all subsequent topics in statistics, including data classification, probability, and inferential methods.
