 Back
BackChapter 1 Study Guide: Data Collection in Statistics
Study Guide - Smart Notes
 Tailored notes based on your materials, expanded with key definitions, examples, and context.
Ch. 1 - Data Collection
1.1 Introduction to Data Collection
Data collection is the foundational step in statistics, involving the gathering of information to answer questions or test hypotheses. Understanding the types of data and the methods used to collect them is essential for accurate statistical analysis.
Data: Observations, measurements, or collected information used to describe phenomena.
Data Patterns: Recognizable trends or structures within collected data.
Population: The entire group of individuals or items of interest in a study.
Sample: A subset of the population selected for analysis.
Descriptive Statistics: Methods for organizing, summarizing, and presenting data.
Inferential Statistics: Methods for making predictions or inferences about a population based on sample data.
Example:
If a researcher wants to know the average height of all American adults, the population is all American adults, and a sample might be 100 randomly selected adults.
1.2 Types of Statistical Studies
Statistical studies can be classified based on how data is collected and whether the researcher intervenes in the process.
Observational Study: The researcher observes subjects without intervention. Hands off.
Designed Experiment: The researcher actively manipulates variables to observe effects. Hands on.
Explanatory Variable: The variable manipulated or categorized to explain changes in the response variable.
Response Variable: The outcome measured in the study.
Example:
Observing the heights of students in a class without influencing their behavior is an observational study. Testing the effect of a new drug by assigning subjects to treatment and control groups is a designed experiment.
1.3 Sampling Methods
Sampling methods determine how individuals are selected from the population. Proper sampling ensures that the sample represents the population accurately.
Simple Random Sample: Every member of the population has an equal chance of being selected.
Stratified Sample: The population is divided into subgroups (strata), and samples are taken from each stratum.
Cluster Sample: The population is divided into clusters, and entire clusters are randomly selected.
Systematic Sample: Every nth member of the population is selected after a random starting point.
Convenience Sample: Individuals are selected based on ease of access.
Example:
To survey student opinions, a researcher might randomly select 10 students from each grade (stratified sample) or select every 5th student from a list (systematic sample).
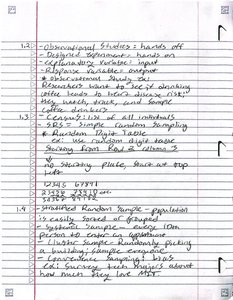
1.4 Sampling Bias and Response Types
Sampling bias occurs when the method of selecting a sample causes it to differ systematically from the population. Understanding response types and minimizing bias is crucial for reliable results.
Sampling Bias: The way you select your sample may skew results.
Nonresponse Bias: Individuals selected for the sample do not participate.
Response Bias: Survey design or interviewer influence causes inaccurate responses.
Example:
If only students who are present in class are surveyed, absent students' opinions are not represented, leading to sampling bias.
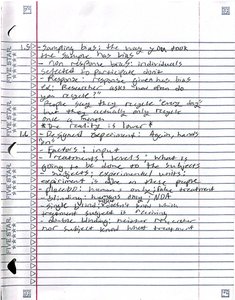
1.5 Experimental Design and Terminology
Experimental design involves planning how to collect data to ensure valid and reliable results. Key terms include:
Subjects: Individuals participating in the study.
Treatment: The condition applied to subjects in an experiment.
Control Group: The group that does not receive the treatment, used for comparison.
Placebo: A fake treatment used to control for psychological effects.
Blinding: Subjects do not know which treatment they receive.
Double-Blinding: Both subjects and researchers do not know which treatment is assigned.
Example:
In a clinical trial, subjects are randomly assigned to receive either a new medication or a placebo. Neither the subjects nor the researchers know which group receives the medication (double-blind).
1.6 Parameters and Statistics
Parameters and statistics are numerical summaries used to describe populations and samples, respectively.
Parameter: A numerical summary of a population (e.g., population mean, μ).
Statistic: A numerical summary of a sample (e.g., sample mean, x̄).
Formulas:
Population mean:
Sample mean:
Example:
If the average height of 100 people is calculated, that value is a sample statistic. If the average height of all people in a country is known, that value is a population parameter.
1.7 Summary Table: Types of Sampling Methods
The following table summarizes the main sampling methods and their characteristics:
Sampling Method | Description | Example |
|---|---|---|
Simple Random | Each individual has equal chance | Randomly select 50 students from a list |
Stratified | Divide into strata, sample from each | Sample 10 students from each grade |
Cluster | Divide into clusters, select entire clusters | Randomly select 2 classrooms, survey all students |
Systematic | Select every nth individual | Survey every 5th student on a roster |
Convenience | Sample based on ease of access | Survey students in the cafeteria |
Additional info:
Some explanations and examples were expanded for clarity and completeness based on standard introductory statistics content.
