 Back
BackChapter 1: The Art and Science of Learning from Data – Foundations of Statistics
Study Guide - Smart Notes
 Tailored notes based on your materials, expanded with key definitions, examples, and context.
Statistics: The Art and Science of Learning from Data
Introduction to Statistics
Statistics is a fundamental discipline that enables us to collect, analyze, and interpret data to answer questions and make informed decisions. In everyday life, statistical concepts are encountered in news, social media, and research, shaping how we understand information.
Statistics is the art and science of collecting, presenting, and analyzing data to answer investigative questions.
Data refers to information gathered through experiments, surveys, or observations.
Statistical methods help answer questions such as: "Does Drug A reduce heartburn compared to Drug B?" or "Is this sample representative of all residents?"
Main Components of Statistics
Statistics is structured around three main components, each essential for drawing meaningful conclusions from data.
Design: Stating the question of interest and planning how to obtain the necessary data.
Description: Summarizing and analyzing the collected data.
Inference: Making decisions and predictions based on the data to answer the original question.
Example: To determine what percentage of students are taller than 6 feet, one might design a survey (Design), calculate the proportion from the results (Description), and infer whether this proportion reflects the entire student body (Inference).
Populations, Samples, and Subjects
Defining Key Terms
Subjects: The entities measured in a study (often people, but can be objects or events).
Population: The complete set of subjects of interest in a study.
Sample: A subset of the population from which data are actually collected.
It is often impractical to collect data from an entire population, so a sample is used to make inferences about the population.
Random Sampling
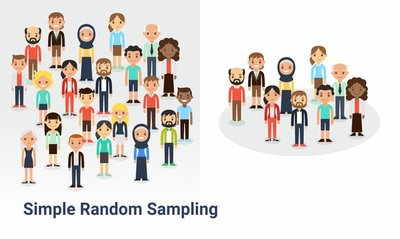
Random sampling is a method used to ensure that every subject in the population has an equal chance of being selected, which helps produce representative and unbiased samples.
Simple Random Sampling: Every member of the population has an equal probability of being chosen.
Convenience Sampling: Selecting subjects that are easiest to reach, which often leads to biased results.
Example: Drawing names from a hat to select students for a survey is an example of simple random sampling.
Statistics vs. Parameters
Understanding the Difference
In statistics, it is crucial to distinguish between parameters and statistics, as they refer to different concepts related to populations and samples.
Parameter: A numerical summary that describes a characteristic of the entire population (e.g., the mean income of all residents in a state).
Statistic: A numerical summary calculated from a sample, used to estimate the corresponding population parameter.
True parameters are usually unknown; statistics are used to make inferences about them.
Notation: The sample mean is denoted as , and the population mean as .
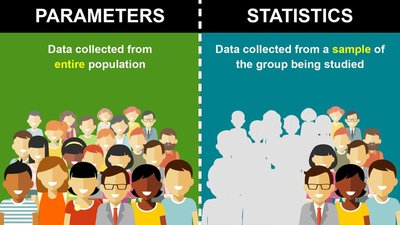
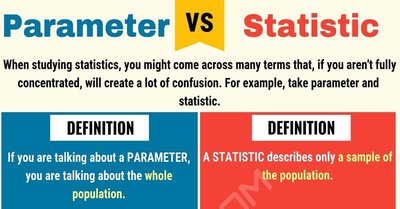
Table: Comparison of Parameters and Statistics
Aspect | Parameter | Statistic |
|---|---|---|
Definition | Numerical summary of a population | Numerical summary of a sample |
Symbol | (mean), (proportion) | (mean), (proportion) |
Data Source | Entire population | Sample from population |
Known/Unknown | Usually unknown | Calculated from data |
Key Takeaways
Statistics is essential for making sense of data and drawing conclusions about populations from samples.
Random sampling is critical for obtaining representative data and minimizing bias.
Understanding the distinction between parameters and statistics is foundational for statistical inference.
