 Back
BackChapter 13: Random Variables – Discrete Probability Models, Binomial & Poisson Distributions
Study Guide - Smart Notes
 Tailored notes based on your materials, expanded with key definitions, examples, and context.
Random Variables
Definition and Notation
A random variable is a variable whose value is determined by the outcome of a random event. Random variables are typically denoted by capital letters (e.g., X), while specific values they take are denoted by lowercase letters (e.g., x).
Discrete random variables can take on a finite or countable number of distinct values (e.g., number of heads in coin tosses).
Continuous random variables can take any value within a range (e.g., weight of a dog).
Probability Models for Random Variables
Probability Distribution
A probability model (or probability distribution) for a random variable consists of:
The set of all possible values the random variable can take.
The probability associated with each value.
For discrete random variables, the probabilities must sum to 1, and each probability must be between 0 and 1.
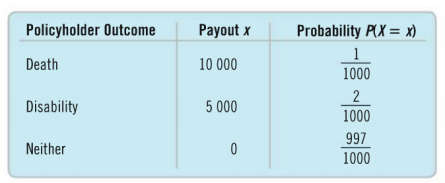
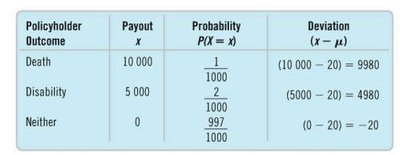
Example: Insurance Payouts
The following table shows a probability model for the random variable X, representing the payout by an insurance company:
Policyholder Outcome | Payout x | Probability P(X = x) |
|---|---|---|
Death | 10,000 | 1/1000 |
Disability | 5,000 | 2/1000 |
Neither | 0 | 997/1000 |
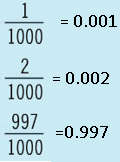
Probabilities as decimals:
1/1000 = 0.001
2/1000 = 0.002
997/1000 = 0.997
Expected Value (Mean) of a Discrete Random Variable
Definition and Calculation
The expected value (or mean) of a discrete random variable X, denoted as , is the long-run average value of X over many repetitions of the experiment. It is calculated as:
For the insurance example:
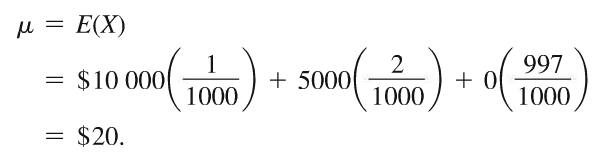
Interpretation: On average, the insurance company expects to pay out $20 per policyholder.
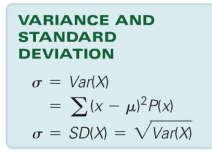
Variance and Standard Deviation of a Discrete Random Variable
Definition and Calculation
The variance of a random variable X measures the spread of its possible values around the mean. The standard deviation is the square root of the variance.
Formulas:
For the insurance example, the deviations from the mean are:
Policyholder Outcome | Payout x | Probability P(X = x) | Deviation (x - μ) |
|---|---|---|---|
Death | 10,000 | 1/1000 | 9,980 |
Disability | 5,000 | 2/1000 | 4,980 |
Neither | 0 | 997/1000 | -20 |
Discrete Probability Models: Binomial and Poisson
Binomial Model
The binomial model describes the probability of obtaining a fixed number of successes in a fixed number of independent Bernoulli trials (each with the same probability of success p).
Parameters: n (number of trials), p (probability of success)
Probability of exactly x successes:
Mean and standard deviation:
Poisson Model
The Poisson model is used for modeling the number of occurrences of an event in a fixed interval of time or space, especially when events are rare and the number of trials is large.
Parameter: (mean number of occurrences)
Probability of exactly x occurrences:
Mean and variance:
Summary Table: Key Properties of Discrete Probability Models
Model | Parameters | Mean | Variance | Probability Formula |
|---|---|---|---|---|
Binomial | n, p | np | np(1-p) | |
Poisson |
Key Takeaways
Random variables can be discrete or continuous; their probability models describe the likelihood of each outcome.
The expected value (mean) and standard deviation summarize the center and spread of a random variable's distribution.
Binomial and Poisson models are fundamental for modeling counts of events under different conditions.
