 Back
Chapter 2: Summarizing Data in Tables and Graphs – Introductory Statistics Study Guide
Study Guide - Smart Notes
 Tailored notes based on your materials, expanded with key definitions, examples, and context.
Summarizing Data in Tables and Graphs
Introduction
Organizing and summarizing data is a fundamental step in statistical analysis. Raw data collected from surveys or experiments must be transformed into meaningful information using tables, graphs, and numerical summaries. This chapter focuses on methods for organizing both qualitative and quantitative data, constructing various graphical displays, and understanding the potential for graphical misrepresentation.
Organizing Qualitative Data
Frequency Distributions and Tables
Qualitative data can be organized using frequency distributions, which list each category and the number of occurrences. This helps to summarize and visualize categorical data efficiently.
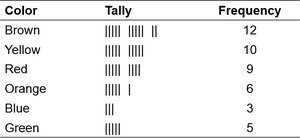
Frequency Distribution: A table showing the number of times each category appears.
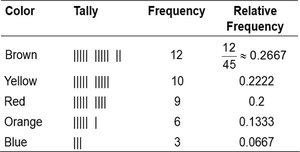
Relative Frequency: The proportion or percentage of observations in each category, calculated as:
Example: Frequency distribution of M&M colors.
Example: Relative frequency distribution of M&M colors.
Bar Graphs
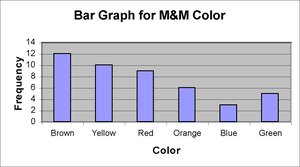
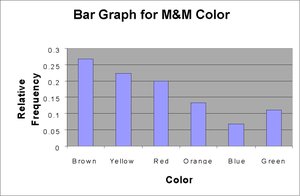
Bar graphs are used to visually represent the frequency or relative frequency of categories. Each bar's height corresponds to the frequency or relative frequency, and bars are of equal width.
Pareto Chart: A bar graph with bars arranged in decreasing order of frequency.
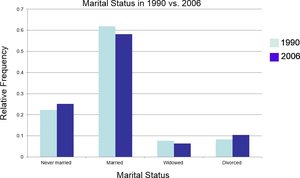
Side-by-Side Bar Graphs: Used to compare two or more data sets, often using relative frequencies for fair comparison.
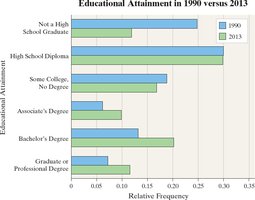
Horizontal Bar Graphs: Useful when category names are lengthy.
Example: Frequency bar graph for M&M colors.
Example: Relative frequency bar graph for M&M colors.
Example: Side-by-side bar graph comparing marital status in 1990 and 2006.
Example: Horizontal bar graph comparing educational attainment in 1990 and 2013.
Pie Charts
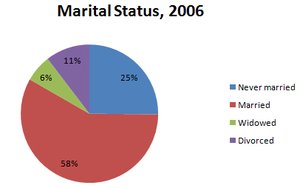
Pie charts display categorical data as sectors of a circle, with each sector's area proportional to the category's frequency or relative frequency.
Construction: Each sector angle is calculated as:
Example: Pie chart for marital status in 2006.
Organizing Quantitative Data: Popular Displays
Discrete Data Tables
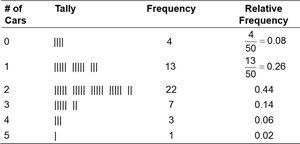
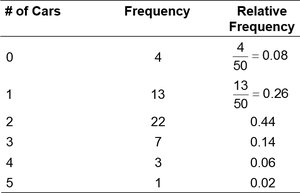
Discrete quantitative data with few values can be organized in frequency and relative frequency tables, similar to qualitative data.
Example: Frequency and relative frequency table for number of cars in a household.
Histograms
Histograms are graphical displays for quantitative data, showing frequencies or relative frequencies for each class interval. Rectangles touch each other, indicating continuous data.
Class Width: The difference between consecutive lower class limits.
Continuous Data: Classes are created using intervals.
Example: Frequency histogram for number of cars in a household.
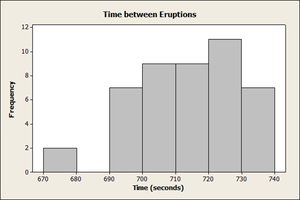
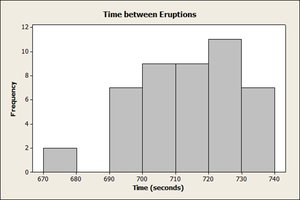
Example: Frequency histogram for time between eruptions (class width 10).
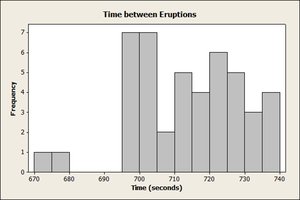
Example: Frequency histogram for time between eruptions (class width 5).
Stem-and-Leaf Plots
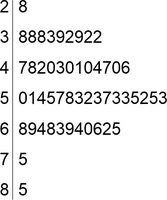
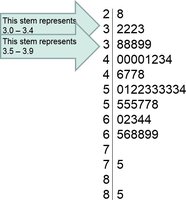
Stem-and-leaf plots display quantitative data while preserving the original values. The stem is formed by digits to the left of the rightmost digit, and the leaf is the rightmost digit.
Split Stems: Used when data are bunched, to better reveal distribution.
Advantage: Raw data can be retrieved from the plot.
Example: Stem-and-leaf plot for unemployment rates.
Example: Split stem-and-leaf plot for unemployment rates.
Dot Plots
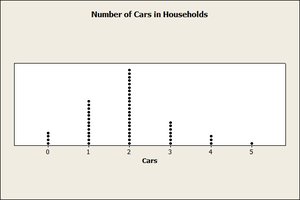
Dot plots are constructed by placing each observation horizontally in increasing order and stacking dots above each value for each occurrence.
Example: Dot plot for number of cars in a household.
Identifying the Shape of a Distribution
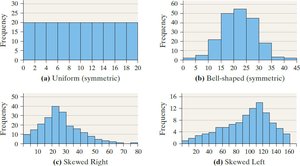
The shape of a distribution can be classified as uniform, bell-shaped, skewed right, or skewed left. Recognizing the shape helps in understanding the underlying data characteristics.
Uniform: Frequencies are evenly spread.
Bell-shaped: Highest frequency in the middle, tails off at both ends.
Skewed Right: Right tail is longer.
Skewed Left: Left tail is longer.
Example: Shapes of distributions.
Example: Histogram for time between eruptions, showing shape.
Time Series Graphs
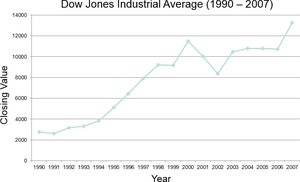
Time series graphs display data measured at different points in time. The horizontal axis represents time, and the vertical axis represents the variable's value. Line segments connect the points to show trends.
Example: Time series graph for Dow Jones Industrial Average (1990–2007).
Graphical Misrepresentations of Data
Misleading or Deceptive Graphs
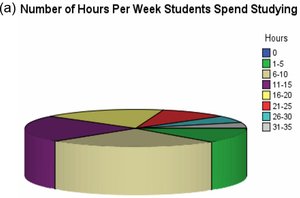
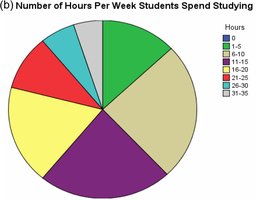
Graphs can be misleading if they distort the data, exaggerate differences, or use inappropriate scales. It is important to construct graphics that accurately represent the data and avoid unnecessary embellishments.
Guidelines for Good Graphics:
Title and label axes clearly, including units and data sources.
Avoid distortion and minimize white space.
Do not use excessive gridlines or backgrounds.
Avoid three-dimensional charts and multiple designs in one graphic.
Always include data and scales.
Example: Misleading pie chart for hours spent studying.
Example: Non-misleading pie chart for hours spent studying.
Summary Table: Types of Graphical Displays
Type | Data Type | Main Purpose |
|---|---|---|
Frequency Table | Qualitative/Discrete Quantitative | Summarize counts for each category |
Bar Graph | Qualitative/Discrete Quantitative | Visualize frequencies or relative frequencies |
Pareto Chart | Qualitative | Highlight most frequent categories |
Pie Chart | Qualitative | Show proportions of categories |
Histogram | Quantitative | Show distribution of data |
Stem-and-Leaf Plot | Quantitative | Display data while preserving raw values |
Dot Plot | Quantitative | Show individual data points |
Time Series Graph | Quantitative (over time) | Show trends over time |
