 Back
BackChapter 3: Describing, Exploring, and Comparing Data – Measures of Center
Study Guide - Smart Notes
 Tailored notes based on your materials, expanded with key definitions, examples, and context.
Describing, Exploring, and Comparing Data
Numerical Summaries of Data
In statistics, data are numeric observations collected from a phenomenon of interest. The entire collection of observations is called a population, while a subset used for analysis is a random sample. To understand data, we describe it using numerical and graphical methods, focusing on four main aspects: shape, outliers, center, and spread (SOCS).
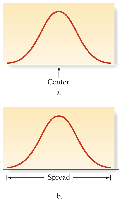
Center: Indicates the typical value or location of the middle of the data set.
Spread: Measures how much the data values vary.
Additional info: The center is often measured by the mean, and the spread by the variance or standard deviation.
Measures of Center
Definition and Importance
A measure of center is a value that represents the middle or typical value of a data set. Common measures include the mean, median, mode, and midrange. These measures help summarize and interpret data, but each has unique properties and uses.
Mean (Arithmetic Mean)
The mean is the sum of all data values divided by the number of values. It is the most commonly used measure of center, but statisticians avoid using the term "average" due to its ambiguity.
Formula for sample mean:
Formula for population mean:
Properties:
Uses every data value.
Not resistant to outliers; a single extreme value can greatly affect the mean.
Sample means from the same population tend to vary less than other measures of center.
Example: For the wait times 50, 25, 75, 35, 50, 25, 30, 50, 45, 25, 20, the mean is minutes.
Median
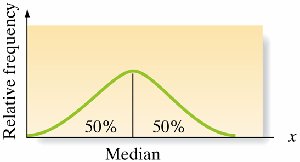
The median is the middle value when data are arranged in order. It divides the data into two equal halves, with 50% of values below and 50% above.
Properties:
Resistant to outliers; extreme values do not affect the median much.
Does not use every data value directly.
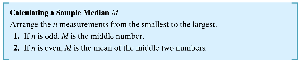
Calculation:
If n is odd, the median is the middle value.
If n is even, the median is the mean of the two middle values.
Example (Odd n): Sorted wait times: 20, 25, 25, 25, 30, 35, 45, 50, 50, 50, 75. Median is 35.0 minutes.
Example (Even n): Sorted wait times: 20, 25, 25, 25, 30, 35, 45, 50, 50, 50, 75, 50. Median is the mean of 35 and 45.
Mode
The mode is the value(s) that occur most frequently in a data set. It can be used with both quantitative and qualitative data.

Properties:
A data set can have no mode, one mode, or multiple modes.
Bimodal: Two values occur with the greatest frequency.
Multimodal: More than two values occur with the greatest frequency.
Example: For wait times 35, 35, 20, 50, 95, 75, 45, 50, 30, 35, 30, the mode is 35 minutes (occurs three times).
Midrange
The midrange is the value midway between the maximum and minimum values in a data set. It is calculated as:
Formula:
Properties:
Very sensitive to extreme values; not resistant.
Rarely used in practice, but easy to compute.
Example: For wait times 20 (min) and 75 (max), midrange is minutes.
Round-Off Rules for Measures of Center
For mean, median, and midrange: Carry one more decimal place than the original data.
For mode: Do not round; use the original value.
Critical Thinking: When Measures of Center Are Not Meaningful
It is important to consider whether calculating a measure of center makes sense for a given data set. For example, using mean or median for zip codes, ranks, or jersey numbers is not meaningful because these numbers are labels or orderings, not measurements. Similarly, "top 5" lists or means of means (without considering population sizes) can be misleading.
Example: Zip codes, ranks, and jersey numbers do not represent measurable quantities.
Example: Calculating the mean of state mean ages does not yield the national mean age.
Calculating the Mean from a Frequency Distribution
When data are summarized in a frequency distribution, the mean can be approximated by multiplying each class midpoint by its frequency, summing these products, and dividing by the total frequency.
Formula: , where f = frequency, m = class midpoint, n = total frequency.
This method provides an approximation, as it uses midpoints instead of actual data values.
Weighted Mean
A weighted mean is used when data values have different levels of importance (weights). It is calculated by multiplying each value by its weight, summing these products, and dividing by the sum of the weights.
Formula:
Example: Calculating grade-point average (GPA) using course credits as weights and grade points as values.
Additional info: Weighted means are common in academic grading and when combining averages from groups of different sizes.
