 Back
BackChapter 3: Describing, Exploring, and Comparing Data – Measures of Center and Variation
Study Guide - Smart Notes
 Tailored notes based on your materials, expanded with key definitions, examples, and context.
Measures of Center
Introduction to Measures of Center
Measures of center are statistical values that describe the central point or typical value in a data set. The most common measures include the mean, median, mode, and midrange. Each measure provides a different perspective on the data's central tendency and is useful in various contexts.
Mean: The arithmetic average, calculated by summing all data values and dividing by the number of values. Sensitive to outliers and not resistant.
Median: The middle value when data is ordered. Resistant to outliers and does not use every data value directly.
Mode: The value(s) that occur most frequently. Can be used with nominal data and may be unimodal, bimodal, multimodal, or have no mode.
Midrange: The value halfway between the maximum and minimum values. Very sensitive to extremes and not resistant.
Resistant statistics are those that are not significantly affected by extreme values (outliers).
Notation for Measures of Center
\( \mu \): Population mean
\( \overline{x} \): Sample mean
\( n \): Number of data values in a sample
\( N \): Number of data values in a population
Calculating the Mean from a Frequency Distribution
When data is grouped into a frequency distribution, the mean is estimated using class midpoints and frequencies. This method provides an approximation of the mean.
Formula:
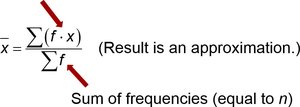
Where f is the frequency of each class and x is the class midpoint.
Weighted Mean
The weighted mean is used when data values have different levels of importance or frequency, represented by weights. It is commonly applied in calculating grade-point averages and other scenarios where values contribute unequally.
Formula:
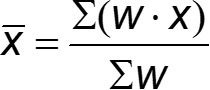
Where w is the weight assigned to each value x.
Measures of Variation
Introduction to Measures of Variation
Measures of variation describe the spread or dispersion of data values in a set. They help quantify how much the data values differ from each other and from the center.
Range: Difference between the maximum and minimum values. Sensitive to outliers and not resistant.
Standard Deviation: Measures the average distance of data values from the mean. Denoted by s for sample and \( \sigma \) for population.
Variance: The square of the standard deviation. Denoted by \( s^2 \) for sample and \( \sigma^2 \) for population.
Standard Deviation of a Sample
The standard deviation quantifies the amount of variation or dispersion in a set of sample values. It is always non-negative and increases with greater variability.
Shortcut Formula for Sample Standard Deviation:
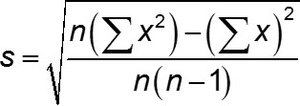
Where n is the sample size, x are the data values.
Variance of a Sample
Variance measures the average squared deviation from the mean. It is useful for statistical inference and is always non-negative.
Notation: \( s^2 \) for sample variance, \( \sigma^2 \) for population variance.
Relationship: Standard deviation is the square root of variance.
Interpreting Standard Deviation
Range Rule of Thumb
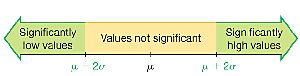
The range rule of thumb helps identify significant values in a data set. For many distributions, most values lie within two standard deviations of the mean.
Significantly low values: \( \mu - 2\sigma \) or lower
Significantly high values: \( \mu + 2\sigma \) or higher
Values not significant: Between \( \mu - 2\sigma \) and \( \mu + 2\sigma \)
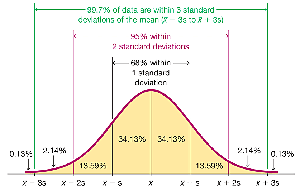
Empirical Rule for Bell-Shaped Distributions
The empirical rule applies to data sets with approximately normal (bell-shaped) distributions. It describes the proportion of data within certain standard deviations from the mean:
About 68% of values fall within 1 standard deviation of the mean.
About 95% of values fall within 2 standard deviations of the mean.
About 99.7% of values fall within 3 standard deviations of the mean.
Summary Table: Measures of Center and Variation
Measure | Definition | Resistant? | Formula |
|---|---|---|---|
Mean | Arithmetic average | No | |
Median | Middle value in ordered data | Yes | Middle value or average of two middle values |
Mode | Most frequent value(s) | Yes | N/A |
Midrange | Midpoint between max and min | No | |
Range | Difference between max and min | No | |
Standard Deviation | Average deviation from mean | No | |
Variance | Square of standard deviation | No |
