 Back
BackChapter 3: Descriptive Measures – Comprehensive Study Notes
Study Guide - Smart Notes
 Tailored notes based on your materials, expanded with key definitions, examples, and context.
Chapter 3: Descriptive Measures
3.1 Measures of Center
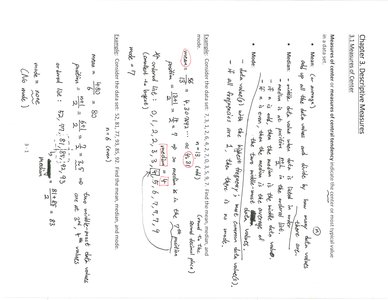
Measures of center are used to summarize a data set with a single value that represents the 'center' or 'typical' value of the data. The three most common measures are the mean, median, and mode.
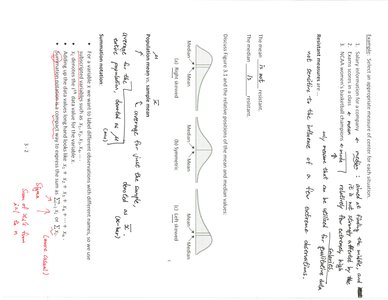
Mean (Arithmetic Average): The sum of all data values divided by the number of values. For a sample, the mean is denoted by \( \bar{x} \), and for a population, by \( \mu \). Formula for the sample mean:
Median: The middle value when the data are ordered. If the number of values is even, the median is the average of the two middle values.
Mode: The value that occurs most frequently in the data set. There can be more than one mode or no mode at all.
Example: For the data set 2, 3, 3, 5, 7:
Mean:
Median: 3 (middle value)
Mode: 3 (appears most frequently)
3.2 Measures of Variation
Measures of variation describe the spread or dispersion of data values. The most common are range, variance, and standard deviation.
Range: The difference between the largest and smallest values in the data set. Formula:
Variance (Sample): The average of the squared differences from the mean. Formula:
Standard Deviation (Sample): The square root of the variance. Formula:
Example: For the data set 2, 4, 4, 4, 5, 5, 7, 9:
Mean: $5$
Variance:
Standard Deviation:
3.3 Measures of Relative Standing and Boxplots
Measures of relative standing indicate the position of a value within a data set. Common measures include percentiles, quartiles, and z-scores. Boxplots provide a graphical summary of data using quartiles.
Percentiles: The p-th percentile is the value below which p% of the data fall.
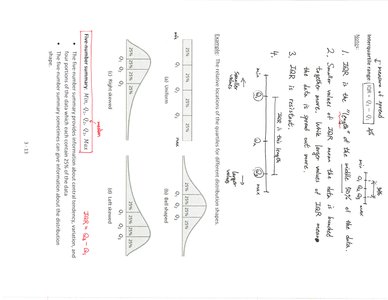
Quartiles: Divide the data into four equal parts. Q1 is the 25th percentile, Q2 is the median, and Q3 is the 75th percentile.
Interquartile Range (IQR): The difference between the third and first quartiles. Formula:
Z-score: Indicates how many standard deviations a value is from the mean. Formula:
Boxplot: A graphical display of the five-number summary: minimum, Q1, median, Q3, and maximum. It helps identify outliers and the spread of the data.
3.4 Empirical Rule and Chebyshev's Theorem
These rules describe the spread of data in relation to the mean for different types of distributions.
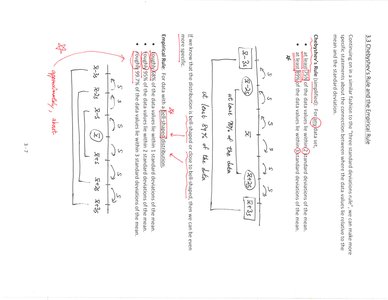
Empirical Rule (for bell-shaped distributions):
About 68% of data fall within 1 standard deviation of the mean.
About 95% within 2 standard deviations.
About 99.7% within 3 standard deviations.
Chebyshev's Theorem (for any distribution): At least of the data values must be within k standard deviations of the mean (for ).
Example: For a data set with mean 50 and standard deviation 5, at least 75% of values are within 10 units (2 standard deviations) of the mean by Chebyshev's Theorem.
3.5 Descriptive Measures for Populations and Samples
Population parameters and sample statistics are used to describe data sets. Population measures use Greek letters, while sample measures use Latin letters.
Population Mean:
Population Variance:
Population Standard Deviation:
Sample Mean:
Sample Variance:
Sample Standard Deviation:
Standardized Values (Z-scores): Used to compare values from different data sets or distributions.
3.6 Outliers and Boxplots
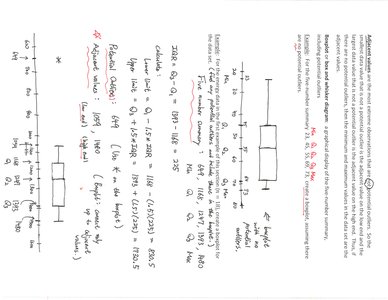
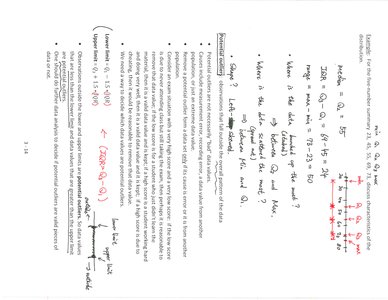
Outliers are data values that are significantly different from the rest of the data. Boxplots help in identifying outliers using the interquartile range (IQR).
Outlier Rule: A value is an outlier if it is below or above .
Boxplot Construction: Draw a box from Q1 to Q3, a line at the median, and 'whiskers' to the minimum and maximum values within the outlier limits. Outliers are plotted individually.
3.7 Summary Table: Measures of Center and Variation
The following table summarizes the main measures of center and variation, their formulas, and their uses.
Measure | Symbol | Formula | Use |
|---|---|---|---|
Mean (Sample) | \( \bar{x} \) | Center | |
Mean (Population) | \( \mu \) | Center | |
Median | Med | Middle value | Center |
Mode | Mode | Most frequent value | Center |
Variance (Sample) | \( s^2 \) | Variation | |
Variance (Population) | \( \sigma^2 \) | Variation | |
Standard Deviation (Sample) | \( s \) | Variation | |
Standard Deviation (Population) | \( \sigma \) | Variation | |
Range | Range | Variation | |
Interquartile Range | IQR | Variation |
Additional info: These notes include expanded explanations, formulas, and examples to ensure clarity and completeness for exam preparation.
