 Back
Chapter 3: Numerically Summarizing Data – Measures of Center, Spread, and Position
Study Guide - Smart Notes
 Tailored notes based on your materials, expanded with key definitions, examples, and context.
Measures of Central Tendency
Introduction to Measures of Center
Measures of central tendency are statistical values that describe the center of a data set. The three main measures are the mean, median, and mode. Understanding the center helps us summarize and compare data distributions.
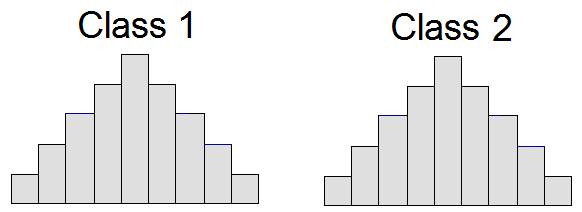
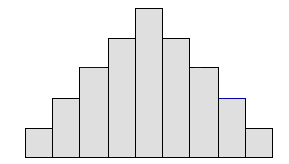
Shape: The form of the data distribution (e.g., symmetric, skewed).
Center: The typical or central value of the data.
Spread: How much the data values vary.
Mode
The mode is the value that occurs most frequently in a data set. There can be more than one mode (bimodal or multimodal) or no mode if all values are unique.
Example: The mode of 15, 19, 12, 20, 12, 23, 19, 11 is 12 (appears most often).
Example: The mode of Red, Yellow, Blue, Red, Green, Purple is Red.
Median
The median is the middle value when the data are ordered. If the number of observations (n) is odd, the median is the middle value; if even, it is the average of the two middle values.
Example: Median of 1, 2, 2, 4, 5 is 2.
Example: Median of 2, 2, 3, 4, 5, 6 is (3 + 4)/2 = 3.5.
Mean
The arithmetic mean (average) is the sum of all values divided by the number of observations. There are two types:
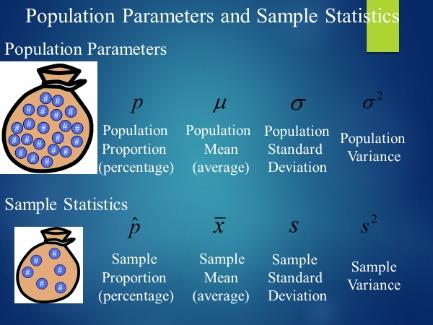
Population Mean (\( \mu \)): Uses all individuals in the population. It is a parameter.
Sample Mean (\( \overline{x} \)): Uses a subset (sample) of the population. It is a statistic.
Formulas:
Population Mean:
Sample Mean:
Example: Calculating Mean, Median, and Mode
Data: 12, 4, 15, 12, 10, 10, 12, 2, 19, 10
Mean:
Median: Order data: 2, 4, 10, 10, 10, 12, 12, 12, 15, 19. Median = (10 + 12)/2 = 11
Mode: 10 and 12 (both appear three times)
Resistant Statistics
A statistic is resistant if it is not significantly affected by extreme values (outliers). The median is resistant, while the mean is not.
Example: Wait times: 1, 1, 2, 2, 3, 5. Mean = 2.33, Median = 2. Adding 102: 1, 1, 2, 2, 3, 5, 102. Mean increases greatly, median changes little.
Choosing the Best Measure of Center
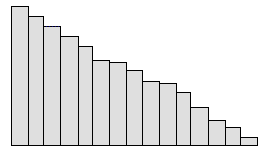
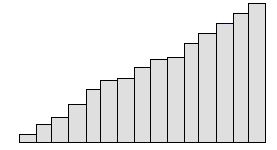
If data are symmetric, use the mean.
If data are skewed, use the median.
Measures of Dispersion (Spread)
Introduction to Measures of Spread
Measures of spread describe how much the data values vary around the center. Common measures include the range, variance, and standard deviation.
Spread helps us understand the consistency and reliability of the data.
Range
The range is the difference between the maximum and minimum values in the data set.
Formula: Range = Maximum value − Minimum value
Variance
The variance measures the average squared deviation of each data value from the mean.
Sample Variance (\( s^2 \)):
Population Variance (\( \sigma^2 \)):
Standard Deviation
The standard deviation is the square root of the variance. It measures the average distance of data values from the mean, in the same units as the data.
Sample Standard Deviation (\( s \)):
Population Standard Deviation (\( \sigma \)):
Example: Calculating Range, Variance, and Standard Deviation
Data: 4, 10, 12, 12, 13, 21
Range: 21 − 4 = 17
Variance and Standard Deviation: Calculate mean, then deviations, then apply formulas above.
Comparing Spread
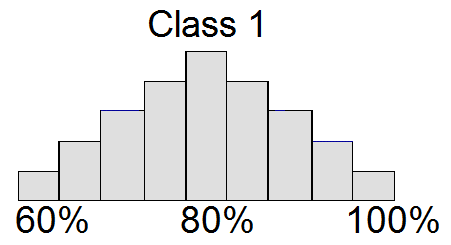
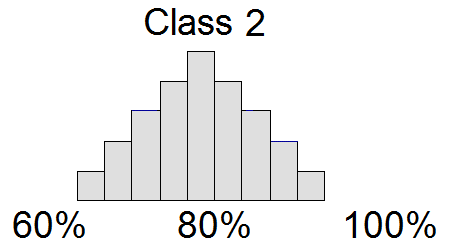
Two data sets can have the same mean but different spreads. The set with the smaller standard deviation is more consistent.
The Empirical Rule and Chebyshev's Theorem
The Empirical Rule (for Bell-Shaped Distributions)
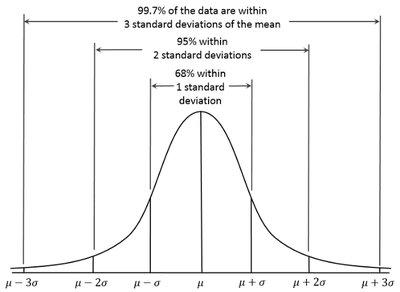
The Empirical Rule describes the spread of data in a normal (bell-shaped) distribution:
About 68% of data falls within 1 standard deviation of the mean.
About 95% falls within 2 standard deviations.
About 99.7% falls within 3 standard deviations.
Chebyshev's Theorem (for Any Distribution)
Chebyshev's Theorem states that for any data set, at least of values lie within standard deviations of the mean (for ).
Example: For , at least 75% of values are within 2 standard deviations of the mean.
Measures of Position
Z-Scores
A z-score measures how many standard deviations an observation is from the mean. It allows comparison of values from different distributions.
Formula: (population) or (sample)
Example: If you scored 83% on a test with a mean of 69% and a standard deviation of 7%,
Outliers and Quartiles
An outlier is a value much lower or higher than most others in the data set. Quartiles divide data into four equal parts:
Q1: 25th percentile
Q2: 50th percentile (median)
Q3: 75th percentile
The interquartile range (IQR) is , representing the range of the middle 50% of the data.
Lower Fence:
Upper Fence:
Values outside these fences are considered outliers.
Five Number Summary and Boxplots
Five Number Summary
The five number summary consists of: minimum, Q1, median (Q2), Q3, and maximum. It provides a concise summary of the distribution.
Order the data, find Q2 (median), then Q1 (median of lower half), and Q3 (median of upper half).
Boxplots
A boxplot visually displays the five number summary. The box spans Q1 to Q3, with a line at the median. "Whiskers" extend to the minimum and maximum values.
Boxplots are useful for comparing distributions and identifying outliers.
Summary Statistics from Frequency Distributions
Mean from a Frequency Distribution
Formula: where is frequency and is the class midpoint.
Standard Deviation from a Frequency Distribution
Formula:
Additional info: These notes cover all major aspects of Chapter 3: Measures of Center, Spread, and Position, including calculation methods, interpretation, and graphical summaries. Examples and formulas are provided for clarity and exam preparation.
