 Back
BackChapter 3: Numerically Summarizing Data – Study Guide
Study Guide - Smart Notes
 Tailored notes based on your materials, expanded with key definitions, examples, and context.
Numerically Summarizing Data
Measures of Central Tendency
Measures of central tendency are used to describe the center or typical value of a dataset. The most common measures include the mean, median, and mode.
Mean: The arithmetic average of all values in the dataset. It is sensitive to extreme values (outliers).
Median: The middle value when the data are ordered from smallest to largest. If the number of observations is even, the median is the average of the two middle values.
Mode: The value that appears most frequently in the dataset.
Example: For the dataset {2, 4, 4, 6, 8}, the mean is 4.8, the median is 4, and the mode is 4.
Measures of Dispersion
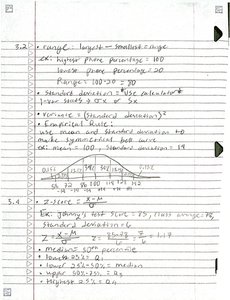
Dispersion measures describe the spread or variability of the data. Common measures include range, variance, and standard deviation.
Range: The difference between the largest and smallest values in the dataset.
Variance: The average of the squared differences from the mean. It quantifies the spread of the data.
Standard Deviation: The square root of the variance. It is a widely used measure of spread.
Example: For the dataset {2, 4, 4, 6, 8}, the range is 8 - 2 = 6.
Key Formulas
Mean:
Sample Variance:
Sample Standard Deviation:
Median: Middle value when data are ordered
Range:
Empirical Rule (68-95-99.7 Rule)
The empirical rule applies to data sets with a normal (bell-shaped) distribution. It states:
Approximately 68% of data falls within 1 standard deviation of the mean.
Approximately 95% of data falls within 2 standard deviations of the mean.
Approximately 99.7% of data falls within 3 standard deviations of the mean.
Example: If the mean is 100 and the standard deviation is 15, then about 68% of values are between 85 and 115.
Percentiles and Quartiles
Percentiles and quartiles are measures that divide the data into equal parts. The median is the 50th percentile, the first quartile (Q1) is the 25th percentile, and the third quartile (Q3) is the 75th percentile.
Percentile: The value below which a given percentage of observations fall.
Quartiles: Q1 (25th percentile), Q2 (50th percentile, median), Q3 (75th percentile).
Example: In a dataset of 100 values, the 25th value (when ordered) is the 25th percentile.
Five-Number Summary
The five-number summary provides a quick overview of the distribution of a dataset. It consists of:
Minimum
First Quartile (Q1)
Median (Q2)
Third Quartile (Q3)
Maximum
Example: For the dataset {2, 4, 4, 6, 8}, the five-number summary is: 2 (min), 4 (Q1), 4 (median), 6 (Q3), 8 (max).
Comparing Measures
Different measures of central tendency and dispersion are appropriate depending on the shape and characteristics of the data.
Mean vs. Median: The mean is affected by outliers, while the median is more robust.
Standard Deviation vs. Range: Standard deviation provides more information about the spread than the range.
Summary Table: Measures of Central Tendency and Dispersion
Measure | Definition | Formula |
|---|---|---|
Mean | Arithmetic average | |
Median | Middle value | - |
Mode | Most frequent value | - |
Range | Difference between max and min | |
Variance | Average squared deviation from mean | |
Standard Deviation | Square root of variance |
Additional info: Some explanations and examples were expanded for clarity and completeness based on standard statistics curriculum.
