 Back
BackChapter 3: Probability – Basic Concepts and Counting in Statistics
Study Guide - Smart Notes
 Tailored notes based on your materials, expanded with key definitions, examples, and context.
Probability: Basic Concepts and Counting
Definitions and Basic Set Theory
Probability is a fundamental concept in statistics that quantifies the likelihood of events occurring in random experiments. Understanding the language and structure of probability is essential for analyzing random phenomena.
Probability: A number between 0 and 1 representing how likely it is that a given event will occur.
Random Experiment: An experiment whose outcome is not known until it is observed.
Sample Space (S): The set of all possible outcomes of a random experiment. Each outcome is listed only once.
Sample Point: An individual element of the sample space.
Event: Any subset of the sample space; a collection of outcomes.
Example: Suppose you roll a die. The sample space is S = {1, 2, 3, 4, 5, 6}. A sample point could be 3. If P is the event that the number on the top of the die is prime, then P = {2, 3, 5}.
Counting Techniques
Counting techniques are used to determine the number of possible outcomes in a sample space, which is essential for calculating probabilities.
Fundamental Counting Principle (Multiplication Rule for Counting): If there are k sets with n1, n2, ..., nk elements respectively, the total number of ways to choose one element from each set is n1 × n2 × ... × nk.
Examples:
Sample space for a pair of dice: 6 × 6 = 36 outcomes.
Dining selections: 3 salads × 5 main courses × 2 desserts = 30 possible meals.
Arranging 5 books: 5! = 120 ways.
5-digit codes (no repetition, first digit not zero): 9 × 9 × 8 × 7 × 6 = 27,216 possible codes.
Probability
Probability quantifies the chance of an event occurring and can be defined in several ways:
Classical (Theoretical) Probability: If all outcomes are equally likely, the probability of event A is:
Empirical (Experimental) Probability: Based on observed data, the probability of event B is:
Law of Large Numbers: As an experiment is repeated, the empirical probability approaches the theoretical probability.
Probability values range from 0 (impossible event) to 1 (certain event).
The probability of the sample space is 1: .
Mutually exclusive events: .
If are mutually exclusive and exhaustive, .
The “TESS” Approach
The TESS approach is a systematic method for solving probability problems:
T: Translate the problem from words to statistical form.
E: Expand the statistical form using formulas.
S: Substitute the values into the expanded form.
S: Simplify and write the probability as a decimal (rounded to three decimal places).
Example: Let S = {1,2,3,4,5,6,7,8,9,10}. If E = {1,2,3}, then .
Decks of Cards
Understanding the structure of a standard deck of cards is crucial for solving probability problems involving cards.
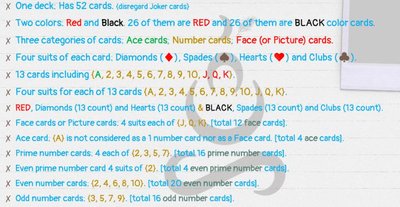
One deck has 52 cards (no Jokers).
Two colors: 26 red (hearts, diamonds), 26 black (spades, clubs).
Three categories: Ace cards, Number cards, Face (Picture) cards.
Four suits: Diamonds (♦), Spades (♠), Hearts (♥), Clubs (♣).
Each suit has 13 cards: A, 2–10, J, Q, K.
Face cards: J, Q, K (12 in total).
Prime number cards: 2, 3, 5, 7 (4 per suit, 16 total).
Even number cards: 2, 4, 6, 8, 10 (20 total).
Odd number cards: 3, 5, 7, 9 (16 total).
Probability of Drawing Cards
When drawing a card at random from a standard deck, probabilities can be calculated using the classical definition.
Probability of drawing a six:
Probability of drawing a face card:
Probability of drawing a diamond:
Probability of drawing a red queen:
Probability of a Complement
The complement of an event A, denoted Ac or A', is the set of outcomes not in A. The probability of the complement is:
and
and
Example: If the probability of obtaining a sum of 11 when rolling two dice is , then the probability of not obtaining a sum of 11 is .
Odds of an Event
The odds of an event E is the ratio of the probability that E will occur to the probability that E will not occur.
Odds in favor of E:
Odds against E:
Odds can be interpreted as "successes : failures".
Example: If and , then , , , Odds(E) = 3:4, Odds(Ec) = 4:3.
Tree Diagrams
Tree diagrams are visual tools used to represent all possible outcomes of a sequence of events. Each branch represents a possible outcome, and probabilities can be assigned to each branch.
Each unique outcome is represented by a path from the start to the end of the tree.
The total number of branches equals the total number of outcomes.
Probabilities along branches can be multiplied to find the probability of a sequence of events.
Example: If a jar contains 3 red and 2 blue marbles, and two marbles are drawn without replacement, a tree diagram can show all possible sequences and their probabilities.
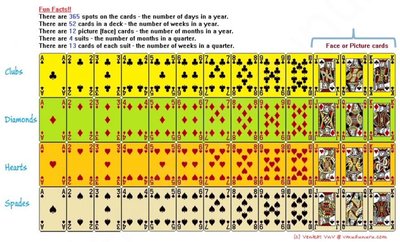
Summary Table: Structure of a Standard Deck of Cards
Suit | Color | Number of Cards | Face Cards |
|---|---|---|---|
Hearts | Red | 13 | J, Q, K |
Diamonds | Red | 13 | J, Q, K |
Clubs | Black | 13 | J, Q, K |
Spades | Black | 13 | J, Q, K |
Additional info: The above table summarizes the main properties of a standard deck, which is essential for probability calculations involving cards.
