 Back
BackChapter 3: Probability – Basic Concepts and Counting Principles
Study Guide - Smart Notes
 Tailored notes based on your materials, expanded with key definitions, examples, and context.
Probability: Basic Concepts and Counting
Introduction to Probability
Probability is a fundamental concept in statistics that quantifies the likelihood of events occurring in random experiments. It provides a mathematical framework for making predictions and informed decisions under uncertainty.
Key Terms in Probability
Probability Experiment: An action or process that leads to well-defined results called outcomes.
Outcome: The result of a single trial of a probability experiment.
Sample Space (S): The set of all possible outcomes of a probability experiment.
Event (E): A subset of the sample space; it may consist of one or more outcomes.
Simple Event: An event that consists of a single outcome.
Examples: Sample Space and Events
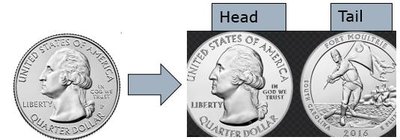
Example 1: Flipping a fair coin. Sample space: S = {Head, Tail}. Event E = "get a head" = {Head}.
Example 2: Rolling a six-sided die. Event A = rolling a 4 (simple event); Event B = rolling at least a 4 (not simple, as it includes 4, 5, and 6).
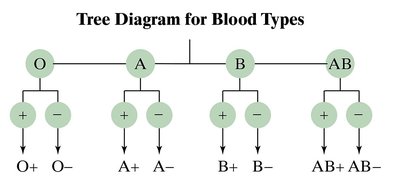
Tree Diagrams and Sample Spaces
Tree diagrams are useful for visualizing all possible outcomes of multi-stage experiments. Each branch represents a possible outcome at each stage.
Example: Determining blood type (O, A, B, AB) and Rh factor (+ or -) yields 8 possible outcomes.
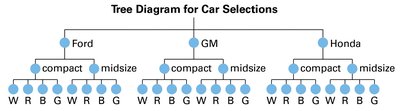
The Fundamental Counting Principle
The Fundamental Counting Principle states that if one event can occur in m ways and a second event in n ways, then the two events together can occur in m × n ways. This principle extends to any number of sequential events.
Formula: For k events with n1, n2, ..., nk possible outcomes each, the total number of outcomes is .
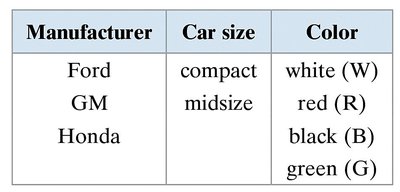
Example: Choosing a car (3 manufacturers, 2 sizes, 4 colors): ways.
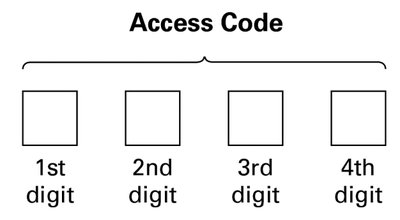
Counting Principle in Access Codes
Example: Four-digit access code, digits 0-9.
Digits not repeated: codes.
Digits can be repeated: codes.
First digit not 0 or 1, digits can repeat: codes.
Types of Probability
Classical (Theoretical) Probability
Classical probability applies when all outcomes in the sample space are equally likely.
Formula:
Example: Rolling a die, probability of rolling a 3:
Empirical (Statistical) Probability
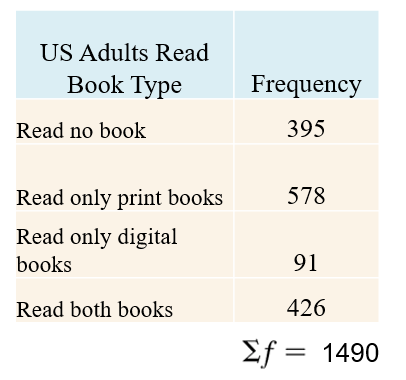
Empirical probability is based on observed data from experiments or surveys.
Formula: , where f is the frequency of event E, and n is the total number of trials.
Example: In a survey of 1490 adults, 578 read only print books.
Law of Large Numbers
The Law of Large Numbers states that as an experiment is repeated many times, the empirical probability approaches the theoretical probability.
Subjective Probability
Subjective probability is based on intuition, educated guesses, or estimates rather than precise calculations or data.
Example: A doctor estimates a 90% chance of recovery for a patient.
Classifying Probability Statements
Classical: Probability of winning a 1000-ticket raffle with one ticket:
Empirical: Probability from survey data (e.g., 0.3 probability a voter is under 35).
Subjective: Probability of getting an A on a test is 0.9 (based on personal judgment).
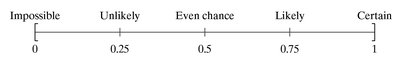
Range of Probabilities Rule
The probability of any event E is always between 0 and 1, inclusive:
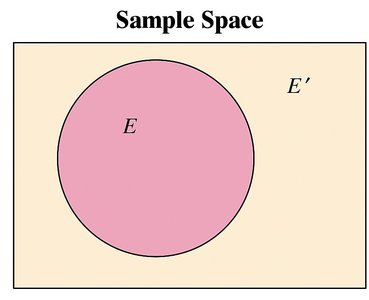
Complementary Events
The complement of event E, denoted E', consists of all outcomes in the sample space not in E. The probabilities of an event and its complement always sum to 1.
Formulas:
Example: Probability of the Complement
Probability that a randomly selected adult read no book:
Probability that a randomly selected adult read a book:
Tree Diagrams and Probability Calculations
Using Tree Diagrams
Tree diagrams help visualize all possible outcomes in multi-stage experiments and are useful for calculating probabilities of compound events.
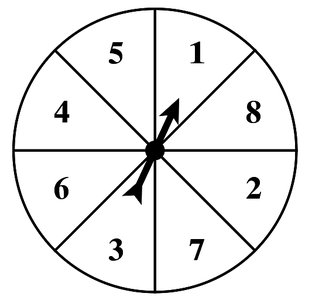
Example: Tossing a coin and spinning a spinner with 8 numbers.
Event A: Tossing a tail and spinning an odd number. There are 4 such outcomes out of 16 total:
Event B: Tossing a head or spinning a number greater than 3. There are 13 such outcomes:
Application: Probability of a Specific Identification Number
College ID number: 8 digits, each 0-9, digits can repeat.
Total possible numbers:
Probability of randomly generating your specific ID:
