 Back
BackChapter 3: Probability – Structured Study Notes for Statistics Students
Study Guide - Smart Notes
 Tailored notes based on your materials, expanded with key definitions, examples, and context.
Probability
Basic Concepts of Probability and Counting
Probability is a fundamental concept in statistics that quantifies the likelihood of events occurring in a random experiment. Understanding probability involves identifying the sample space, events, and outcomes, and applying counting principles to determine possible combinations.
Probability Experiment: An action or trial that produces specific results (counts, measurements, or responses).
Outcome: The result of a single trial in a probability experiment.
Sample Space: The set of all possible outcomes of a probability experiment.
Event: One or more outcomes; a subset of the sample space.
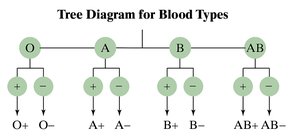
Example: Determining the sample space for blood types (O, A, B, AB) and Rh factor (positive or negative) yields eight possible outcomes.
Simple Events
A simple event consists of a single outcome, while a compound event includes more than one outcome. Identifying simple events is crucial for calculating probabilities accurately.
Simple Event: An event with only one outcome (e.g., selecting a specific defective part).
Compound Event: An event with multiple outcomes (e.g., rolling at least a 4 on a die).
Example: Rolling a 4, 5, or 6 on a die is not a simple event because it includes three outcomes.
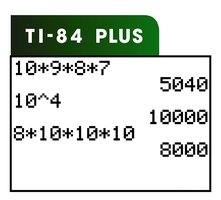
The Fundamental Counting Principle
The Fundamental Counting Principle is used to determine the number of ways multiple events can occur in sequence. If one event can occur in m ways and another in n ways, the total number of ways both can occur is m × n.
Formula: For k events, each with n_i possible outcomes:
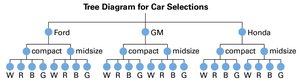
Example: Choosing a manufacturer, car size, and color from the table below:
Manufacturer | Car size | Color |
|---|---|---|
Ford | compact, midsize | white (W), red (R), black (B), green (G) |
GM | compact, midsize | white (W), red (R), black (B), green (G) |
Honda | compact, midsize | white (W), red (R), black (B), green (G) |
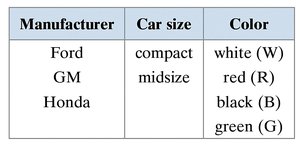
There are 3 manufacturers × 2 sizes × 4 colors = 24 possible combinations.
Counting with Restrictions
When restrictions are applied, such as digits not being repeated or certain digits excluded, the Fundamental Counting Principle adapts accordingly.
Example: Access code with four digits (0–9):
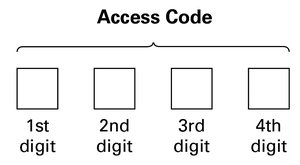
Each digit can be used only once:
Each digit can be repeated:
Each digit can be repeated, but first digit cannot be 0 or 1:
Types of Probability
Probability can be classified into three main types: classical, empirical, and subjective.
Classical (Theoretical) Probability: Each outcome is equally likely.
Empirical (Statistical) Probability: Based on observed data.
Subjective Probability: Based on intuition, educated guesses, or estimates.
Example: Rolling a die:
Event A: Rolling a 3.
Event B: Rolling a 7. (not possible)
Event C: Rolling less than 5.
Empirical Probability in Practice
Empirical probability uses real-world data to estimate the likelihood of events.
Example: Survey of U.S. adults on book reading:
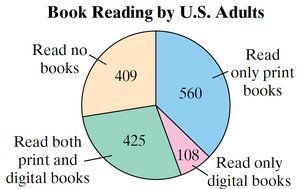
Probability that the next adult surveyed read only print books:
Example: Probability of a social media user being 25–34 years old:
Ages | Frequency, f |
|---|---|
13 to 17 | 84 |
18 to 24 | 459 |
25 to 34 | 765 |
35 to 44 | 546 |
45 to 54 | 432 |
55 to 64 | 369 |
65 and over | 345 |
Total | 3000 |
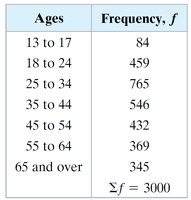
Probability:
Law of Large Numbers
The Law of Large Numbers states that as an experiment is repeated many times, the empirical probability approaches the theoretical probability.

Subjective Probability
Subjective probability is based on personal judgment, intuition, or experience rather than formal calculations.
Example: A doctor estimates a 90% chance of recovery for a patient.
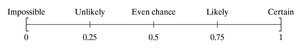
Range of Probabilities Rule
The probability of any event is always between 0 and 1, inclusive. This is known as the range of probabilities rule.
Formula:
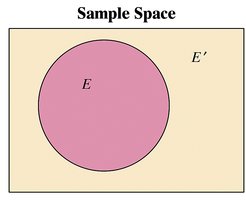
Complementary Events
The complement of an event E, denoted E', consists of all outcomes in the sample space not included in E. The sum of the probabilities of an event and its complement is 1.
Formula:
Tree Diagrams in Probability
Tree diagrams are visual tools used to enumerate all possible outcomes of a probability experiment, especially when multiple events occur in sequence.
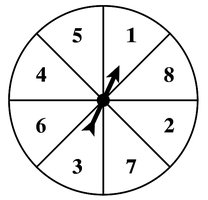
Example: Tossing a coin and spinning a spinner with numbers 1–8.
Event A: Tossing a tail and spinning an odd number (T1, T3, T5, T7).
Event B: Tossing a head or spinning a number greater than 3 (H1–H8, T4–T8).
Application of the Fundamental Counting Principle
For identification numbers or codes, the Fundamental Counting Principle helps determine the total number of possible combinations.
Example: College ID number with eight digits (0–9, digits can repeat): possible numbers.
Probability of randomly generating your specific ID:
Additional info: Academic context and explanations have been expanded for clarity and completeness. All included images directly reinforce the adjacent educational content.
