 Back
BackChapter 4: Probability – Concepts, Rules, and Applications
Study Guide - Smart Notes
 Tailored notes based on your materials, expanded with key definitions, examples, and context.
Probability: Basic Concepts and Definitions
Inferential Statistics and Probability
Inferential statistics involves drawing conclusions about a population based on data collected from a sample. Probability provides the mathematical foundation for making these inferences, quantifying the likelihood of various outcomes.
Experiment: An activity or process that produces observable outcomes (e.g., tossing a coin, rolling a die).
Event: Any collection of outcomes from an experiment.
Simple Event: An event that cannot be decomposed further (e.g., rolling a 3 on a die).
Compound Event: An event composed of two or more simple events.
Sample Space (S): The set of all possible outcomes of an experiment.
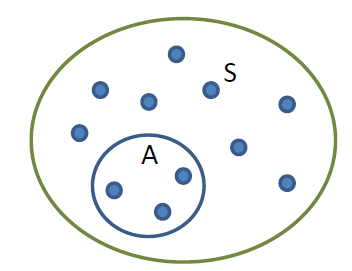
Example: Rolling a die: S = {1, 2, 3, 4, 5, 6}; Event A (even number) = {2, 4, 6}
Tree Diagrams and Sample Spaces
Tree diagrams are useful for visualizing all possible outcomes of multi-stage experiments, such as sequences of births or coin tosses.
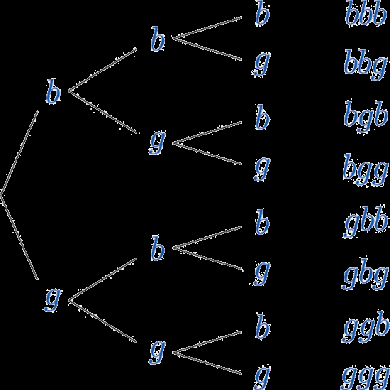
Example: Three births: S = {bbb, bbg, bgb, bgg, gbb, gbg, ggb, ggg}
Sample Space Representation
Sample spaces can also be represented visually, such as with a spinner or wheel, where each outcome is equally likely.
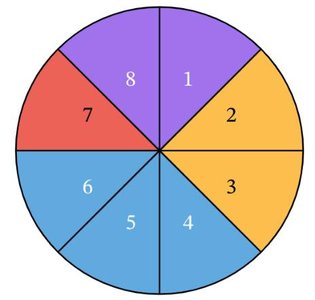
Example: S = {1P, 2Y, 3Y, 4B, 5B, 6B, 7R, 8P}
Relationships Among Events
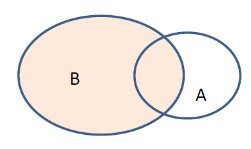
Subsets and Complements
An event A is a subset of the sample space S (A ⊆ S). The complement of an event A, denoted A' or A̅, consists of all outcomes in S that are not in A.
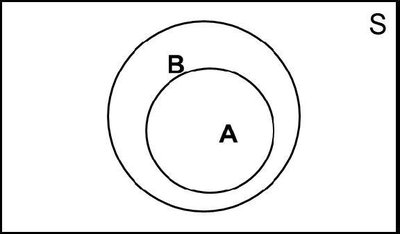
Example: If A = {1, 2}, then A' = {3, 4, 5, 6} in S = {1, 2, 3, 4, 5, 6}
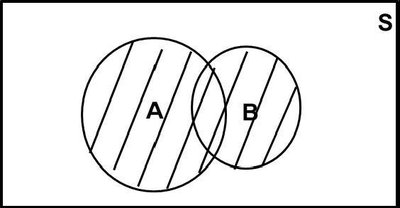
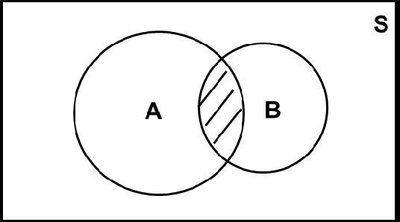
Union and Intersection of Events
The union (A ∪ B) includes all outcomes in A, B, or both. The intersection (A ∩ B) includes only outcomes common to both A and B.
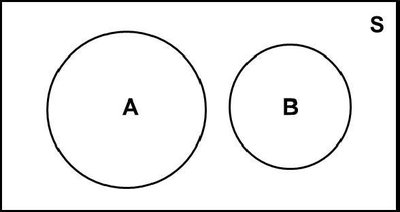
Mutually Exclusive (Disjoint) Events: Events with no outcomes in common (A ∩ B = ∅).
Contingency Tables
Definition and Application
A contingency table (two-way table) displays the frequency distribution of variables, allowing for the analysis of relationships between categorical variables.
Positive Test (P) | Negative Test (N) | |
|---|---|---|
Uses Drugs (D) | 44 | 6 |
Does Not Use Drugs (D') | 90 | 860 |
Example Questions:
Number who got positive test results and used drugs: 44
Number who got positive test results or used drugs: 44 + 90 + 6 = 140
Among drug users, number with negative results: 6
Basic Properties and Approaches to Probability
Probability Notation and Properties
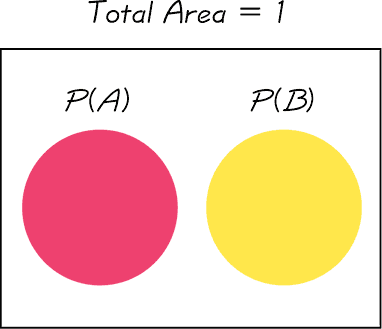
Probability of event A: P(A)
0 ≤ P(A) ≤ 1
P(S) = 1 (the probability of the sample space is 1)
P(impossible event) = 0
Approaches to Probability
Relative Frequency Approximation:
Classical Approach (Equally Likely Outcomes):
Subjective Probability: Based on personal judgment or experience.
Law of Large Numbers: As the number of trials increases, the relative frequency probability approaches the actual probability.
Addition and Multiplication Rules
Addition Rule
The probability that event A or event B occurs is given by:
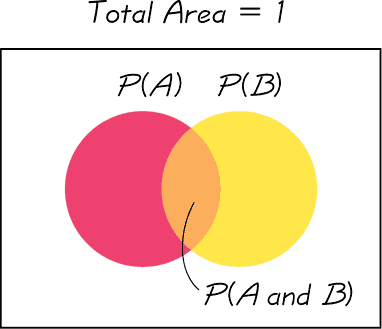
If A and B are mutually exclusive:
Multiplication Rule
The probability that both events A and B occur is:
If A and B are independent:
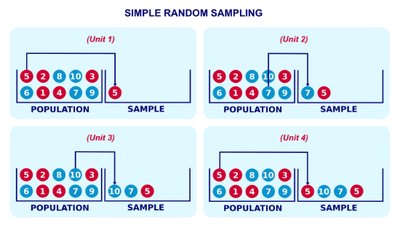
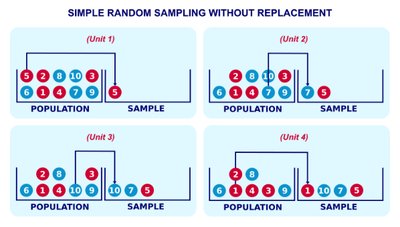
Sampling With and Without Replacement
With Replacement: Each selection is independent.
Without Replacement: Selections are dependent; probabilities change after each draw.
Complements, Conditional Probability, and Bayes’ Theorem
Complementation Rule
The probability of an event not occurring is:
Conditional Probability
The probability of event A occurring given that event B has occurred is:
Example: If 13 out of 20 people are female, and 8 own a pet, the probability that a randomly selected person is female is , and the probability that a person owns a pet is .
Applications of Conditional Probability
Given a person is a Democrat, probability they are male:
Given a person is female, probability they are Democrat:
Summary Table: Key Probability Rules
Rule | Formula | When to Use |
|---|---|---|
Addition Rule | Finding probability of A or B | |
Multiplication Rule | Finding probability of A and B | |
Complement Rule | Finding probability of not A | |
Conditional Probability | Probability of A given B |
Additional info:
Bayes’ Theorem, while not explicitly covered in the provided material, is a key extension of conditional probability for updating probabilities based on new evidence.
Contingency tables are foundational for later topics such as chi-square tests and analysis of categorical data.
