 Back
Chapter 4: Probability – Introductory Statistics Study Notes
Study Guide - Smart Notes
 Tailored notes based on your materials, expanded with key definitions, examples, and context.
Probability
Introduction to Probability
Probability is a fundamental concept in statistics that quantifies how likely an event is to occur. It provides a mathematical framework for making predictions and decisions based on data.
Probability: How often something occurs or is expected to occur.
Probability gives us information about data in a widely accessible format.
Probability theory can be used to make decisions about populations, such as by applying the Rare Event Rule.
Rare Event Rule for Inferential Statistics
The Rare Event Rule is used to determine whether an observed event is so unlikely under a given assumption that the assumption should be questioned.
If, under a given assumption, the probability of an observed event is extremely small, then the assumption is probably not correct.
Such an event is called statistically significant because it is too unlikely to occur just by chance.
This rule is foundational for hypothesis testing and will be revisited later in the course.
Basic Probability Terms
Key Definitions
Understanding basic probability terms is essential for analyzing random processes and outcomes.
Event: An outcome of a procedure.
Simple event: An event that cannot be broken down into simpler components.
Outcome: The result of a single trial in a procedure.
Sample Space: The set of all possible outcomes of a procedure.
Sample Space and Tree Diagrams
Tree Diagrams
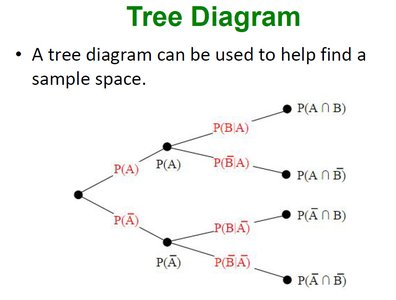
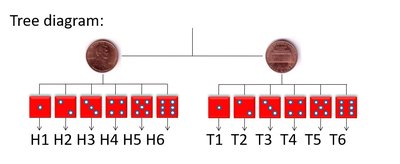
Tree diagrams are visual tools used to systematically list all possible outcomes (sample space) of a random experiment.
Each branch represents a possible outcome at each stage.
Tree diagrams help in finding probabilities and organizing complex experiments.
Examples of Sample Spaces
Sample spaces can be constructed for simple experiments such as rolling dice or flipping coins.
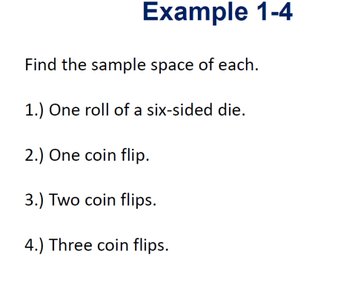
One roll of a six-sided die: {1, 2, 3, 4, 5, 6}
One coin flip: {Heads, Tails}
Two coin flips: {HH, HT, TH, TT}
Three coin flips: {HHH, HHT, HTH, HTT, THH, THT, TTH, TTT}
Complex Sample Spaces
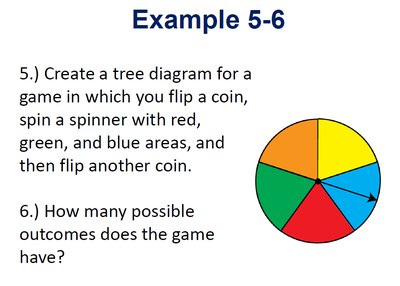
Tree diagrams can be used for more complex experiments, such as games involving multiple steps.
Example: Flip a coin, spin a spinner with red, green, and blue areas, then flip another coin.
To find the total number of possible outcomes, multiply the number of outcomes for each step.
Fundamental Counting Principle
Definition and Application
The Fundamental Counting Principle is a method for determining the total number of possible outcomes in a multi-step experiment.
Multiply the number of possible outcomes for each part of a procedure.
Useful for calculating probabilities in complex scenarios.
Example: Car Selection
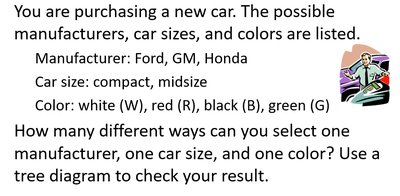
Suppose you are purchasing a new car. The possible manufacturers, car sizes, and colors are listed:
Manufacturer: Ford, GM, Honda
Car size: compact, midsize
Color: white (W), red (R), black (B), green (G)
To find the total number of ways to select one manufacturer, one car size, and one color, multiply the number of choices for each category: ways.
Counting Examples
Counting principles are applied to various real-world scenarios:
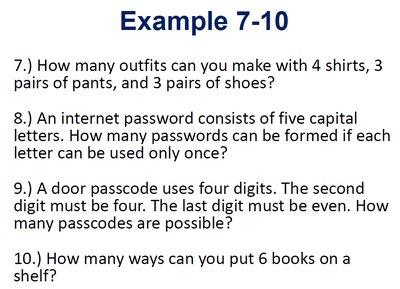
How many outfits can you make with 4 shirts, 3 pairs of pants, and 3 pairs of shoes? outfits.
Internet password with five capital letters (no repeats): possible passwords.
Door passcode with four digits, second digit must be four, last digit must be even: Apply restrictions and multiply possibilities.
Ways to put 6 books on a shelf: (factorial).
Factorial
Definition and Calculation
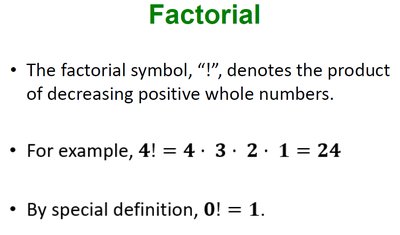
The factorial symbol, "!", denotes the product of decreasing positive whole numbers. Factorials are used in counting and probability calculations.
For example,
By special definition,
Factorial Examples
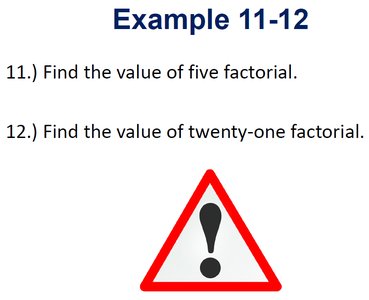
Find the value of five factorial:
Find the value of twenty-one factorial: (very large number, typically calculated with a calculator or software)
Probability Rules
Basic Rules
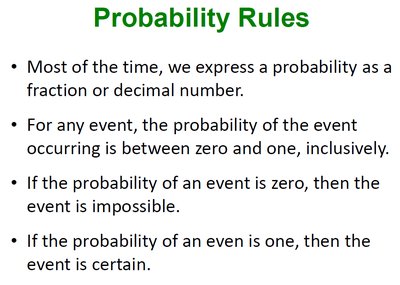
Probability values are always between 0 and 1, inclusive. These rules help interpret and calculate probabilities.
Probability is usually expressed as a fraction or decimal.
For any event,
If , the event is impossible.
If , the event is certain.
Example: Valid Probability Values
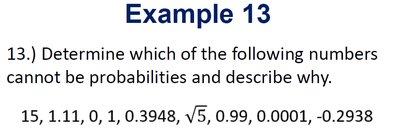
Determine which numbers cannot be probabilities and explain why:
Valid probabilities: 0, 1, 0.3948, 0.99, 0.0001
Invalid probabilities: 15, 1.11, , -0.2938 (because they are not between 0 and 1)
Classical vs. Relative Frequency Probability
Definitions and Comparison
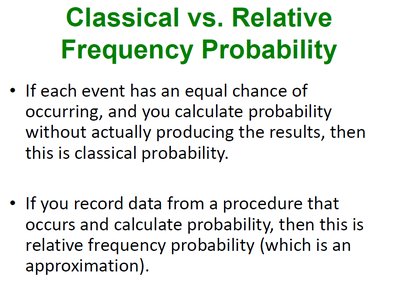
There are two main approaches to calculating probability: classical and relative frequency.
Classical Probability: Each event has an equal chance of occurring; probability is calculated without actually producing the results.
Relative Frequency Probability: Probability is calculated based on data from actual experiments; it is an approximation.
Calculating Probability
Probability Formula
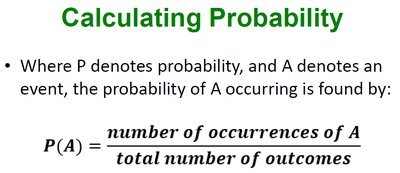
The probability of an event A is calculated as the ratio of the number of occurrences of A to the total number of possible outcomes.
Formula:
This formula applies to both classical and relative frequency probability.
Summary Table: Probability Concepts
Concept | Definition | Example |
|---|---|---|
Event | Outcome of a procedure | Rolling a 4 on a die |
Sample Space | All possible outcomes | {1,2,3,4,5,6} for a die |
Classical Probability | Equal chance, theoretical | Probability of heads on a coin: 0.5 |
Relative Frequency Probability | Based on experiment | Observed heads in 100 flips |
Factorial | Product of decreasing numbers | 4! = 24 |
Probability Rule | 0 ≤ P(A) ≤ 1 | P(A) = 0.99 |
