 Back
BackChapter 4: Probability – Structured Study Notes for Statistics Students
Study Guide - Smart Notes
 Tailored notes based on your materials, expanded with key definitions, examples, and context.
Probability: Basic Concepts and Rules
Introduction to Probability
Probability is a fundamental concept in statistics, representing the likelihood or chance of an event occurring. It is essential for making inferences about populations based on sample data, a process known as inferential statistics.
Inferential Statistics: Drawing conclusions about a population from a sample.
Probability: Quantifies uncertainty and is used to compute chances of events.
Definitions and Key Terms
Understanding probability requires familiarity with several foundational terms:
Experiment: An activity that generates data (e.g., tossing a coin, recording ages).
Event: Any collection of outcomes from an experiment.
Simple Event: An indivisible outcome (cannot be broken down further).
Compound Event: An event composed of two or more simple events.
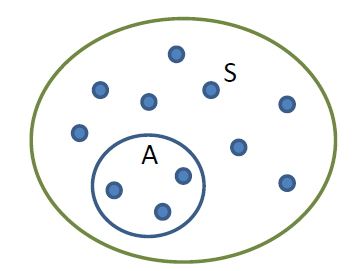
Sample Space (S): The set of all possible outcomes of an experiment.
Example: Rolling a die: Sample space S = {1, 2, 3, 4, 5, 6}. Event A: rolling an even number = {2, 4, 6}.
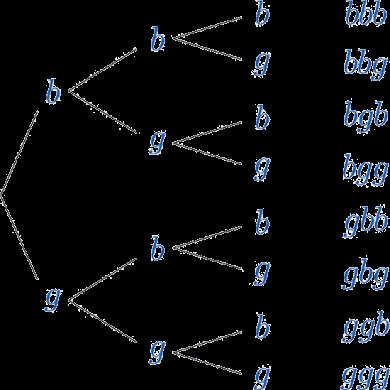
Sample Space and Tree Diagrams
Sample spaces can be visualized using tree diagrams, which systematically list all possible outcomes.
Example: Three births: Sample space = {bbb, bbg, bgb, bgg, gbb, gbg, ggb, ggg}.
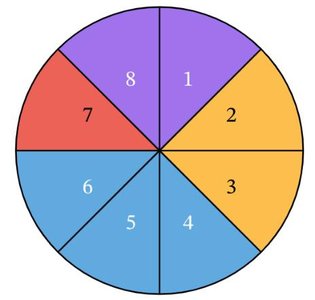
Visualizing Sample Spaces
Sample spaces can also be represented using diagrams such as wheels for random experiments.
Relationships Among Events
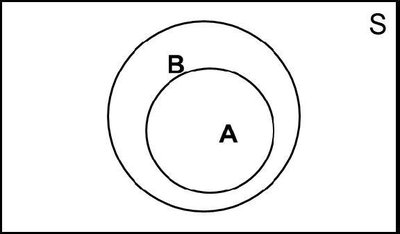
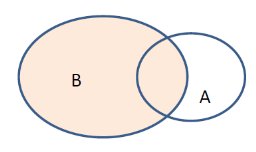
Subsets and Complements
Events can be related as subsets or complements within the sample space.
Subset: Event A is a subset of B (A ⊆ B) if every outcome in A is also in B.
Complement: The complement of event A (denoted A̅ or A') includes all outcomes in S not in A.
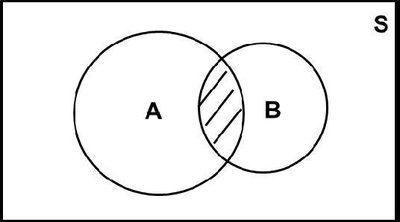
Union and Intersection of Events
The union and intersection of events describe combined and shared outcomes, respectively.
Union (A ∪ B): Outcomes in A, B, or both.
Intersection (A ∩ B): Outcomes common to both A and B.

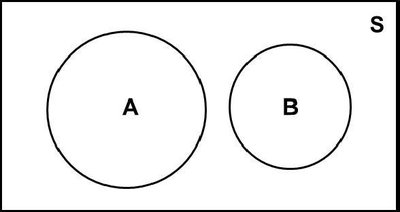
Mutually Exclusive (Disjoint) Events
Events are mutually exclusive if they have no outcomes in common.
Example: Rolling a die: Event A = {1, 2}, Event B = {3, 4}. A and B are disjoint.
Contingency Tables
Definition and Application
A contingency table (two-way frequency table) is used to display categorical data and analyze relationships between variables.
Purpose: Comparison and classification of categorical data.
Example: Drug test results by user status.
Positive (P) | Negative (N) | |
|---|---|---|
Drug User (D) | 44 | 6 |
Not Drug User (D') | 90 | 860 |
Basic Approaches to Computing Probability
Probability Notation and Properties
Probability is denoted by P. For event A, P(A) is the probability that A occurs.
Range: 0 ≤ P(A) ≤ 1
Sample Space: P(S) = 1
Impossible Event: P(impossible event) = 0
Relative Frequency Approximation
Probability is estimated by the ratio of the number of times an event occurs to the total number of trials.
Formula:
Law of Large Numbers: As trials increase, the relative frequency approaches the true probability.
Classical Approach (Equally Likely Outcomes)
When all outcomes are equally likely, probability is calculated as:
Formula:
Subjective Probability
Probability is estimated based on personal judgment or knowledge when outcomes are not equally likely.
Addition and Multiplication Rules
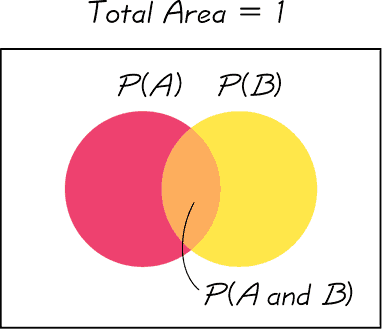
Addition Rule
The addition rule calculates the probability of the union of two events:
Formula:
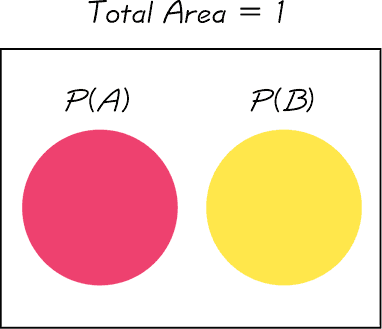
Mutually Exclusive Events: If A and B are disjoint,
Multiplication Rule
The multiplication rule calculates the probability of the intersection of two events:
Formula:
Independence: If A and B are independent,
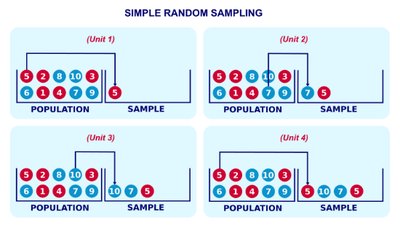
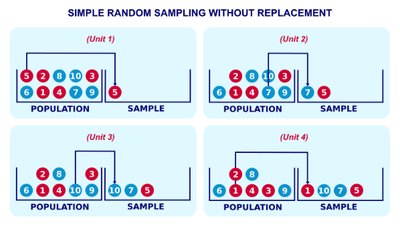
Sampling With and Without Replacement
Sampling methods affect the calculation of probabilities:
With Replacement: Each selection is independent.
Without Replacement: Selections are dependent.
Complements, Conditional Probability, and Bayes’ Theorem
Complementation Rule
The probability of an event not occurring is the complement:
Formula:
Conditional Probability
Conditional probability is the probability of event A occurring given that event B has occurred:
Formula:
Bayes’ Theorem (Additional info)
Bayes’ Theorem allows for the calculation of conditional probabilities when multiple events are involved. It is especially useful in updating probabilities based on new information.
Formula:
Additional info: Bayes’ Theorem is not explicitly shown in the provided material but is a standard part of conditional probability topics.
Summary Table: Probability Rules and Relationships
Concept | Formula | Explanation |
|---|---|---|
Relative Frequency | Empirical probability based on observed data | |
Classical Probability | Assumes equally likely outcomes | |
Addition Rule | Probability of A or B or both | |
Multiplication Rule | Probability of A and B | |
Complement | Probability of event not occurring | |
Conditional Probability | Probability of A given B |
