 Back
BackChapter 5: Probability – Structured Study Notes
Study Guide - Smart Notes
 Tailored notes based on your materials, expanded with key definitions, examples, and context.
Probability
Random Phenomenon
A random phenomenon is a process where individual outcomes appear unpredictable, but a regular distribution of outcomes emerges when the process is repeated many times. Common examples include rolling dice or tossing coins.
Key Point: The long-term behavior of random phenomena can be described using probability.
Example: Rolling a die or tossing a coin repeatedly.
Probability
Probability is the proportion of times an outcome can be expected to occur in the long run. It is often interpreted as the relative frequency of an event.
Key Point: Probability values range from 0 to 1, or equivalently, 0% to 100%.
Example: Probability of rolling a 5 on a die:
Example: Probability of tossing tails:
Sample Space and Events
The sample space (S) is the set of all possible outcomes of a random phenomenon. An event is any subset of the sample space.
Key Point: Sample spaces are foundational for calculating probabilities.
Example: Tossing a single coin:
Example: Tossing two coins:
Example: Rolling two dice and observing the sum:
Probability Models
A probability model assigns probabilities to events in a random phenomenon, based on the sample space.
Key Point: Models can be classical (equally likely outcomes) or empirical (based on observed frequencies).
Properties of Probability
Probability has several fundamental properties:
Property 1:
Property 2: (the probability of all possible outcomes is 1)
Property 3: If , event A cannot occur.
Assigning Probabilities
Probabilities can be assigned in two main ways:
Classical Probability: If all outcomes are equally likely,
Empirical Probability: Based on experiment,
Example: Probability of drawing a heart from a deck:
Venn Diagrams and Probability
Venn Diagrams
A Venn diagram visually represents events and their probabilities, often used to illustrate relationships such as overlap (intersection) and union.
Example: Probability of owning a cat and/or dog among students.
Additional Properties of Probability
Property 4: The probability that event A does not occur:
Property 5: If A and B are disjoint (no outcomes in common):
Property 6: For any two events:
Example:
Independence, Dependence, and Conditional Probability
Independent and Dependent Events
Independent events are those where the outcome of one does not affect the outcome of the other. Dependent events are those where the outcome of one affects the outcome of the other.
Example (Independent): Tossing heads on two separate coin tosses.
Example (Dependent): Drawing two aces in succession from a deck of cards.
Conditional Probability
Conditional probability is the probability that event A occurs given that event B has occurred, denoted .
Formula:
Example: Probability of drawing an ace given an ace has already been drawn.
Example: Using dice, if B is the event "sum is 2, 3, or 4" and A is "sum is even":
Probability Properties for Independent Events
Property 7: If A and B are independent:
Property 8: A and B are independent if
Example: In dice rolls, event A (sum is even) and event C (first die is 6) are independent.
General Probability Properties
Property 9:
Property 10:
Example: Calculating conditional probabilities using dice or colored balls.
Tree Diagrams and Probability
Tree Diagrams
A tree diagram is a graphical tool used to visualize all possible outcomes of a sequence of events, especially useful for calculating probabilities in multi-step experiments.
Key Point: Each branch represents a possible outcome, and probabilities can be multiplied along branches to find joint probabilities.
Example: Drawing two balls from a box containing 3 red, 2 black, and 4 white balls.
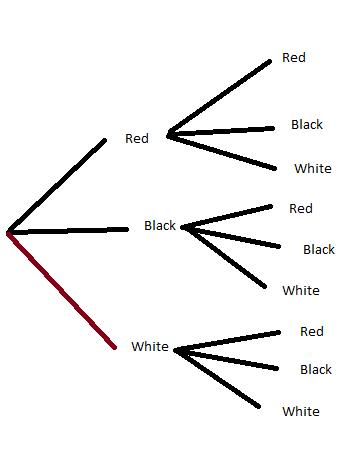
Application: Probability of selecting two white balls:
Additional info: The tree diagram visually clarifies the process of sequential probability calculation, especially for dependent events.
