 Back
Chapter 6 Review: Scatterplots, Correlation, and Linear Models – Guided Study Notes
Study Guide - Smart Notes
 Tailored notes based on your materials, expanded with key definitions, examples, and context.
Q1. True/False: Understanding Scatterplots and Correlation
Background
Topic: Scatterplots and Correlation
This set of true/false questions tests your understanding of the basics of scatterplots, what types of variables they require, and what information they can and cannot provide about relationships between variables.
Key Terms:
Scatterplot: A graph that shows the relationship between two quantitative variables.
Correlation: A measure of the strength and direction of a linear relationship between two variables.
Outlier: A data point that is far from the other points in the data set.
Causation: When a change in one variable directly causes a change in another variable.
Step-by-Step Guidance
Review what types of variables are appropriate for scatterplots (quantitative vs. categorical).
Consider what information a scatterplot can reveal (e.g., patterns, trends, outliers, relationships).
Think about the difference between correlation and causation.
Recall what a negative correlation means in terms of how the variables move together.
Try solving on your own before revealing the answer!
Final Answers:
To make a scatterplot I need exactly two categorical variables – False (scatterplots require two quantitative variables).
A scatterplot can tell you if one variable causes the other variable to occur – False (it shows association, not causation).
A scatterplot can tell you if there is a relationship between the variables – True.
A scatterplot allows you to spot outliers – True.
A negative correlation means that when one variable increases, the other variable tends to decrease – True.
Q2. Sketching Scatterplots with Different Correlations
Background
Topic: Visualizing Correlation
This question asks you to visualize what strong and weak correlations look like in scatterplots. Understanding these patterns helps you interpret real data.
Key Terms:
Strong Negative Correlation: Points are closely clustered around a downward-sloping line.
Weak Correlation: Points are more scattered and do not closely follow a line.
Step-by-Step Guidance
For a strong negative correlation, imagine points forming a tight band that slopes downward from left to right.
For a very weak correlation, the points should be widely scattered with no clear upward or downward trend.
Try sketching these patterns on paper or in your notes, labeling the axes with generic variable names.
Try sketching before revealing the answer!
Final Answer:
Strong negative correlation: Points form a narrow band sloping downward.
Very weak correlation: Points are scattered randomly with no clear trend.
Q3. Interpreting a Scatterplot: Years of Education vs. Salary
Background
Topic: Interpreting Scatterplots and Correlation Direction
This question asks you to interpret a real scatterplot, describe the relationship, write a sentence about the correlation, and draw a line of best fit.
Key Terms:
Positive Correlation: As one variable increases, the other tends to increase.
Line of Best Fit (Regression Line): A straight line that best represents the data on a scatterplot.
Step-by-Step Guidance
Look at the overall pattern of the points. Do they trend upward, downward, or show no trend?
Decide if the relationship is positive, negative, or about zero.
Write a sentence using both variables (years of education and salary) to describe the relationship.
Think about where you would draw a straight line that best fits the data points (the line should go through the "middle" of the points, showing the general trend).
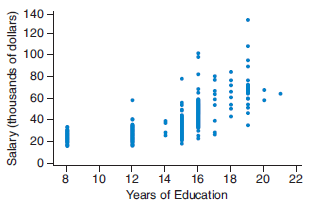
Try describing and drawing before revealing the answer!
Final Answer:
The relationship is positive (as years of education increase, salary tends to increase).
Example sentence: "There is a positive correlation between years of education and salary; people with more years of education tend to have higher salaries."
The line of best fit would slope upward from left to right, roughly through the center of the data points.
Q4. Range of the Correlation Coefficient
Background
Topic: Correlation Coefficient
This question tests your knowledge of the possible values for the correlation coefficient, which measures the strength and direction of a linear relationship.
Key Formula:
The correlation coefficient can take values between and $1$.
Step-by-Step Guidance
Recall that measures linear association and is always between two specific values.
Think about what , , and mean in terms of the relationship between variables.
Try filling in the blanks before revealing the answer!
Final Answer:
The correlation coefficient is a number between -1 and 1.
Q5. Matching Scatterplots to Correlation Coefficients
Background
Topic: Interpreting Correlation Coefficient Values
This question asks you to match scatterplots to their corresponding correlation coefficients, based on the strength and direction of the relationship shown.
Key Terms:
r = -0.03: Very weak or no linear relationship.
r = 0.64: Moderate positive linear relationship.
r = -0.86: Strong negative linear relationship.
Step-by-Step Guidance
Look for the plot where points are scattered randomly with no clear trend (this matches the correlation closest to zero).
Find the plot where points trend upward but are somewhat scattered (this matches the moderate positive correlation).
Find the plot where points trend downward and are closely clustered (this matches the strong negative correlation).
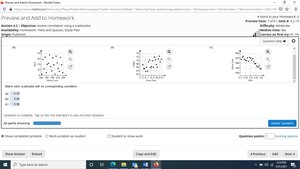
Try matching before revealing the answer!
Final Answer:
Strike outs vs. wins (uniformly scattered): r = -0.03
Shoe size vs. height (scattered but going uphill): r = 0.64
ERA vs. strike outs (close and going downhill): r = -0.86
Q6. Using a Linear Model for Prediction (Hot Dog and Soft Drink Prices)
Background
Topic: Linear Regression and Prediction
This question asks you to describe the correlation between two variables, and use a linear model to make predictions based on given values.
Key Terms and Formulas:
Linear Model: , where is the predicted value, is the explanatory variable, is the slope, and is the intercept.
Correlation: Describes the direction and strength of the relationship.
Step-by-Step Guidance
Look at the scatterplot to determine if the relationship is positive, negative, or zero.
Identify which variable is on the x-axis (hot dog price) and which is on the y-axis (soft drink price).
To predict the soft drink price for a hot dog price of x = 4$ into the linear model equation.
To predict the hot dog price for a soft drink price of xy = 5$.
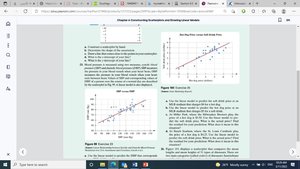
Try describing and setting up the equations before revealing the answer!
Final Answer:
The correlation is positive (as hot dog prices increase, soft drink prices tend to increase).
To predict the soft drink price at a hot dog price of x = 4$ into the linear model equation.
To predict the hot dog price at a soft drink price of y = 5x$ in the linear model equation.
Q7. Variables: Weight and Height
Background
Topic: Identifying Explanatory and Response Variables
This question asks you to identify which variable is explanatory, which is response, interpret an ordered pair, and predict the sign of the correlation.
Key Terms:
Explanatory Variable: The variable you think explains or predicts changes in the response variable.
Response Variable: The variable you think is affected by the explanatory variable.
Ordered Pair (x, y): Represents a specific value for each variable (e.g., (66, 142) means height = 66 inches, weight = 142 pounds).
Correlation Sign: Positive if both variables increase together, negative if one increases as the other decreases.
Step-by-Step Guidance
Decide which variable (weight or height) is likely to be explanatory and which is response.
Interpret what the ordered pair (66, 142) means in this context.
Think about whether taller people tend to weigh more or less, and what that means for the sign of the correlation.
Try answering before revealing the answer!
Final Answer:
Explanatory variable: Height (h)
Response variable: Weight (w)
(66, 142) means a person who is 66 inches tall and weighs 142 pounds.
The correlation should be positive because, generally, as height increases, weight also increases.
Q8. Finding Values of t for Given Years
Background
Topic: Defining Variables for Time
This question asks you to convert calendar years to the variable , which represents the number of years since 2010.
Key Formula:
Step-by-Step Guidance
For 2010, subtract 2010 from 2010 to find .
For 2025, subtract 2010 from 2025 to find .
Try calculating before revealing the answer!
Final Answer:
For 2010:
For 2025:
Q9. True/False: Association and Correlation
Background
Topic: Association, Correlation, and Causation
This set of true/false questions tests your understanding of the definitions and distinctions between association, correlation, and causation.
Key Terms:
Association: When the value of one variable changes as the other changes.
Correlation: A specific type of association for numerical variables, measuring linear relationship.
Causation: When one variable directly affects another.
Step-by-Step Guidance
Review the definitions of association, correlation, and causation.
Think about whether all associations are correlations, and whether all correlations imply causation.
Try answering before revealing the answer!
Final Answers:
There is an association between the explanatory and response variables if the response variable changes as the explanatory variable changes – True.
An association of numerical explanatory and response variables is called a correlation – True.
An association between two variables that does not necessarily mean there is causation – True.
Q10. Multiple Choice: Interpreting a Correlation Coefficient
Background
Topic: Interpreting the Value of r
This question asks you to interpret what a correlation coefficient of 0.12 means in the context of a study about speeding and time of day.
Key Terms:
Correlation Coefficient (r): Measures the strength and direction of a linear relationship.
Positive/Negative/Moderate/Weak: Describes the direction and strength of the relationship.
Step-by-Step Guidance
Recall that values close to 0 indicate a weak or no linear relationship.
Consider what a value of 0.12 means (very weak positive correlation).
Review the answer choices and eliminate those that do not match the interpretation of a weak correlation.
Try choosing before revealing the answer!
Final Answer:
d) There is insufficient evidence to make any conclusions about the relationship between the variables.
A correlation of 0.12 is very weak and does not indicate a meaningful linear relationship.
Q11. Bank Robberies: Scatterplot, Correlation, and Linear Model
Background
Topic: Scatterplots, Correlation, and Linear Regression
This multi-part question asks you to construct and interpret a scatterplot, compute and interpret the correlation coefficient, draw a line of best fit, and use the model for prediction.
Key Terms and Formulas:
Scatterplot: Graph of (number of robberies) vs. (years since 2000).
Correlation Coefficient (r): Measures strength and direction of linear association.
Linear Model:
Intercepts: -intercept (when ), -intercept (when )
Step-by-Step Guidance
Plot the given data points on a scatterplot with on the x-axis and on the y-axis.
Describe the overall trend (e.g., increasing, decreasing, linear, nonlinear).
Calculate the correlation coefficient using the formula or a calculator, and interpret its value.
Draw a line that best fits the data (line of best fit).
Set up the linear model equation to estimate values for given years or numbers of robberies.
Find the intercepts and interpret their meaning in context.
Try working through each part before revealing the answer!
Final Answers:
a) Scatterplot: Points trend downward as increases.
b) The association is negative and strong (number of robberies decreases over time).
c) is negative and close to -1, indicating a strong negative linear relationship.
d) The line of best fit slopes downward.
e) Use the model to estimate for (2016).
f) Set and solve for to estimate the year.
g) -intercept: Predicted number of robberies in 2000; -intercept: Theoretical year when robberies reach zero.
Q12. Matching Correlation Coefficients to Graphs
Background
Topic: Interpreting Correlation Coefficient Strength and Direction
This question asks you to match scatterplots to given correlation coefficients based on the pattern of the points.
Key Terms:
r = -0.51: Moderate negative correlation.
r = 0.98: Very strong positive correlation.
r = 0.18: Very weak positive correlation.
Step-by-Step Guidance
Look for the plot with points closely following an upward line (very strong positive correlation).
Find the plot with points loosely trending downward (moderate negative correlation).
Find the plot with points scattered with a slight upward trend (very weak positive correlation).
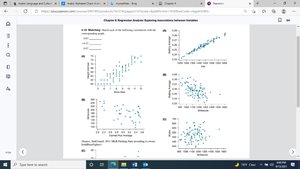
Try matching before revealing the answer!
Final Answer:
Graph with points tightly clustered and going up: r = 0.98
Graph with points loosely going down: r = -0.51
Graph with points scattered and slight upward trend: r = 0.18
