 Back
Chapter 7: Estimating Population Parameters and Sample Sizes
Study Guide - Smart Notes
 Tailored notes based on your materials, expanded with key definitions, examples, and context.
Estimating a Population Proportion
Point Estimate and Sample Proportion
In statistics, a point estimate is a single value used to approximate a population parameter. The sample mean () is the best point estimate of the population mean (), and the sample proportion () is the best point estimate of the population proportion ().
Sample Proportion (): Calculated as the number of successes () divided by the sample size ():
Example: If 85% of 1007 adults know what Twitter is, then is the best estimate for .
Confidence Interval for a Proportion
A confidence interval is a range of values used to estimate the true value of a population parameter. The margin of error is the maximum likely difference between the sample statistic and the population parameter, with a specified probability (confidence level).
Confidence Level: The probability (often expressed as a percentage) that the confidence interval contains the population parameter. Common levels are 90%, 95%, and 99%.
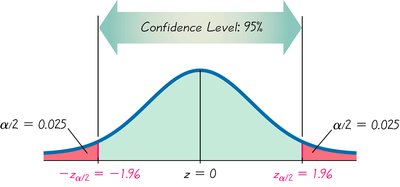
Level of Significance (): The probability that the confidence interval does not contain the parameter. For example, corresponds to a 95% confidence level.
Critical Value (): The value separating the tail area in the standard normal distribution.
To construct a confidence interval for a proportion, use the formula:
: sample proportion
: sample proportion of failures
Formula for Confidence Interval:
Example: For a 95% confidence level, .
Sample Size for Estimating Proportion
To determine the sample size needed for estimating a proportion:
If an estimate is known:
If no estimate is known, use :
Round-Off Rule: Always round up to the next whole number if the computed sample size is not an integer.
Estimating a Population Mean
Confidence Interval for the Mean
To estimate the population mean (), use a confidence interval. If the population standard deviation () is unknown, use the sample standard deviation () and the Student t distribution.
Formula for Confidence Interval:
Calculator Tip: Use TInterval on a TI-83/84 calculator for confidence intervals when is unknown.
Sample Size for Estimating the Mean
To determine the sample size needed for estimating the mean:
If is unknown, use .
Round-Off Rule: Always round up to the next whole number.
Common Critical Values
Confidence Level | Critical Value () | |
|---|---|---|
90% | 0.10 | 1.645 |
95% | 0.05 | 1.96 |
99% | 0.01 | 2.576 |
Student t Distribution
Properties and Comparison to Normal Distribution
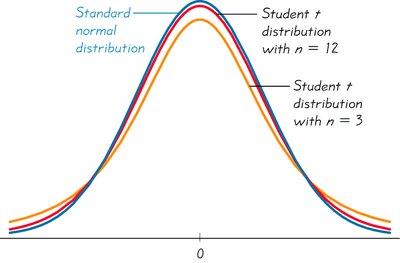
The Student t distribution is used when estimating the mean with small sample sizes and unknown population standard deviation. It has several important properties:
The t distribution varies with sample size (degrees of freedom).
It has a symmetric bell shape, similar to the normal distribution, but is wider for small samples.
The mean of the t distribution is 0.
The standard deviation is greater than 1 and decreases as sample size increases.
As sample size increases, the t distribution approaches the normal distribution.
Chapter 7 Summary Table
Parameter | Confidence Interval Method | Sample Size Formula |
|---|---|---|
Proportion () | 1–PropZInt | |
Mean () | TInterval |
Additional info: The notes include calculator instructions for constructing confidence intervals and emphasize rounding up sample sizes to ensure adequate precision.
