 Back
BackChapter 8: Hypothesis Testing – Foundations and Procedures
Study Guide - Smart Notes
 Tailored notes based on your materials, expanded with key definitions, examples, and context.
Hypothesis Testing
Introduction to Hypothesis Testing
Hypothesis testing is a fundamental statistical method used to make inferences about population parameters based on sample data. It provides a structured framework for evaluating claims or statements about a population.
Hypothesis: A claim or statement about a property of a population.
Hypothesis Test: A procedure for testing a claim about a property of a population using sample data.
The Scientific Method and Hypothesis Testing
The process of hypothesis testing mirrors the scientific method:
Ask a Question
Conduct Research
Construct a Hypothesis
Test the Hypothesis (Experiment)
Analyze Data and Draw Conclusions
Report Results
Proof by Contradiction in Hypothesis Testing
Hypothesis testing uses logic similar to proof by contradiction. Instead of showing an assumption is impossible, we show it is highly improbable given the data.
Assume the null hypothesis is true.
Determine if the observed sample is unlikely under this assumption.
If unlikely, reject the null hypothesis in favor of the alternative.
Formulating Hypotheses
Null and Alternative Hypotheses
Null Hypothesis (H0): A statement that the value of a population parameter is equal to some claimed value. It is tested directly and is assumed true unless evidence suggests otherwise.
Alternative Hypothesis (H1 or HA): A statement that the parameter differs from the null hypothesis. It uses the symbols <, >, or ≠.
Example: Testing if the average heart rate differs from a claimed value.
Significance Level (α)
The significance level (denoted by α) is the probability of rejecting the null hypothesis when it is actually true (Type I error). Common choices are 0.05, 0.01, and 0.10.
Types of Hypothesis Tests
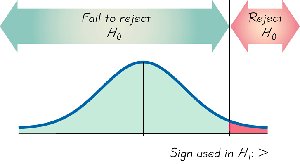
Right-Tailed Test
In a right-tailed test, the critical region (where we reject H0) is in the right tail of the distribution. The alternative hypothesis uses the > symbol.
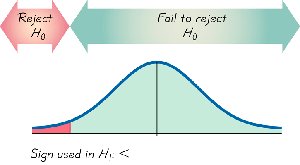
Left-Tailed Test
In a left-tailed test, the critical region is in the left tail. The alternative hypothesis uses the < symbol.
Two-Tailed Test
In a two-tailed test, the critical region is split between both tails. The alternative hypothesis uses the ≠ symbol.
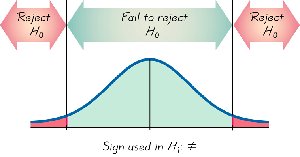
For two-tailed tests, α is divided equally between the two tails.
The original claim typically involves an equality (=).
Logic and Steps of Hypothesis Testing
Decision Logic
Assume H0 is true.
Evaluate how unlikely the sample result is under this assumption.
If the result is unlikely, reject H0 and accept H1.
If not, fail to reject H0 (insufficient evidence).
Process for Hypothesis Testing
Identify the claim.
Translate the claim into symbolic form.
Identify the type of test (left-tailed, right-tailed, or two-tailed).
State the null and alternative hypotheses.
Choose the significance level α.
Convert the sample statistic into the appropriate test statistic (z or t).
Making Decisions: Critical Value and P-Value Approaches
Critical Value Approach
The critical value is the cutoff point that defines the boundary of the critical region. If the test statistic falls in this region, we reject H0.
Right-tailed test: critical value > 0
Left-tailed test: critical value < 0
Two-tailed test: two critical values (positive and negative)
If the test statistic is more extreme than the critical value(s), reject H0. Otherwise, fail to reject H0.
P-Value Approach
The P-value is the probability of obtaining a test statistic at least as extreme as the observed value, assuming H0 is true.
Left-tailed test: P-value = area to the left of the test statistic
Right-tailed test: P-value = area to the right of the test statistic
Two-tailed test: P-value = twice the area in the tail beyond the test statistic
Decision rule: If P-value < α, reject H0.
Key Formulas
Test Statistic (z for large samples):
P-value (for z-test): (left-tailed) (right-tailed) (two-tailed)
Summary Table: Types of Tests and Decision Rules
Test Type | Alternative Hypothesis | Critical Region | Decision Rule |
|---|---|---|---|
Right-tailed | H1: > | Right tail | Reject H0 if test statistic > critical value |
Left-tailed | H1: < | Left tail | Reject H0 if test statistic < critical value |
Two-tailed | H1: ≠ | Both tails | Reject H0 if test statistic < lower critical value or > upper critical value |
Examples and Applications
Example 1: Testing if the mean heart rate is less than a claimed value using a left-tailed test.
Example 2: Testing if the mean differs from a claimed value using a two-tailed test.
Additional info: In practice, the choice between z and t statistics depends on whether the population standard deviation is known and the sample size. For small samples with unknown population standard deviation, use the t-distribution.
