 Back
BackChapter 9: Correlation and Regression – Linear Regression and Model Assessment
Study Guide - Smart Notes
 Tailored notes based on your materials, expanded with key definitions, examples, and context.
Chapter 9: Correlation and Regression
Section 9.2: Linear Regression
Linear regression is a statistical method used to model the relationship between two quantitative variables. It allows us to predict the value of one variable (the dependent variable) based on the value of another (the independent variable) by fitting a straight line to observed data.
Regression Lines
Definition: A regression line is a straight line that best fits a set of data points on a scatter plot. It summarizes the overall trend between two variables and helps make predictions about one variable based on the other.
Interpretation: The regression line is analogous to planning a straight road through a neighborhood, aiming to pass as centrally as possible among scattered houses (data points).
Purpose: It provides the best linear summary of the relationship between the variables.
Residuals
Definition: A residual is the difference between an observed value and the value predicted by the regression line for the same x-value.
Calculation: For each data point, residual = observed y - predicted y.
Interpretation: Residuals measure how far off the regression line is for each observation. Small residuals indicate a good fit.
Least Squares Regression
Method: The regression line is determined by minimizing the sum of the squared residuals. This is known as the least squares regression method.
Reason for Squaring: Squaring residuals prevents positive and negative differences from canceling each other out and emphasizes larger errors.
Best-Fit Line: The line with the smallest possible total of squared residuals is considered the best fit for the data.
The Equation of a Regression Line
General Form: The regression line for variables x (independent) and y (dependent) is given by:
where m is the slope and b is the y-intercept.
The regression line always passes through the point , where and are the means of x and y, respectively.
Formulas:
where is the number of data pairs.

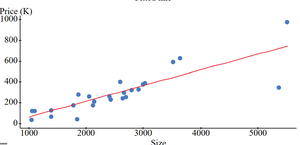
Example: Home Prices vs. Size
Context: The relationship between home size (in square feet) and asking price (in thousands of dollars) is analyzed using regression.
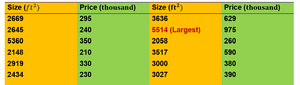
Data Table: Sample data for home sizes and prices:
Size (ft2) | Price (thousand) | Size (ft2) | Price (thousand) |
|---|---|---|---|
2669 | 295 | 3636 | 628 |
2645 | 240 | 5514 (Largest) | 975 |
5690 | 350 | 2058 | 260 |
2148 | 210 | 3517 | 590 |
2919 | 330 | 3000 | 380 |
2434 | 230 | 3027 | 390 |
Scatter Plot: The scatter plot shows a positive linear trend between home size and price.
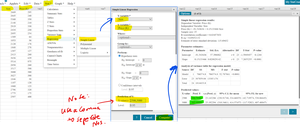
Regression Output: Statistical software (e.g., StatCrunch) can be used to compute the regression equation and related statistics.
R-squared (Coefficient of Determination)
Definition: R-squared measures the proportion of the variance in the dependent variable (y) that is explained by the independent variable (x) using the regression model.
Interpretation: R-squared values range from 0 to 1. A higher value indicates a better fit, meaning more of the variation in y is explained by x.
Analogy: Think of R-squared as a pizza. The slice representing x shows how much of y's variation is explained by x; the rest of the pizza represents other factors.
Residual Plots and Model Fit
Residual Plot: A plot of residuals (vertical axis) versus predicted values (horizontal axis) helps assess the appropriateness of the linear model.
Good Fit: If the residuals are randomly scattered around zero with no clear pattern, the linear model is appropriate.
Poor Fit: Patterns, curves, or systematic structures in the residual plot suggest that a linear model may not be suitable.
Summary Table: Key Concepts in Linear Regression
Concept | Definition | Purpose |
|---|---|---|
Regression Line | Best-fit straight line through data | Summarize and predict y from x |
Residual | Observed y minus predicted y | Measure fit for each data point |
Least Squares | Minimizes sum of squared residuals | Find best-fit line |
R-squared | Proportion of y's variance explained by x | Assess model fit |
Residual Plot | Plot of residuals vs. predicted values | Diagnose model appropriateness |
Additional info: In practice, regression analysis is widely used in economics, business, engineering, and the social sciences to model and predict outcomes based on observed data. Always check residual plots to ensure the linear model is appropriate for your data.
