 Back
BackChapter 9: Correlation and Regression – Study Notes
Study Guide - Smart Notes
 Tailored notes based on your materials, expanded with key definitions, examples, and context.
Correlation and Regression
Introduction
This chapter introduces the concepts of correlation and regression, which are fundamental tools in statistics for analyzing the relationship between two or more variables. Understanding these concepts allows us to describe, measure, and test the strength and direction of relationships in data.
Section 9.1: Correlation
Definition and Types of Correlation
Correlation is a statistical relationship between two variables, represented as ordered pairs (x, y).
Independent variable (x): Also called the explanatory variable; plotted on the horizontal axis.
Dependent variable (y): Also called the response variable; plotted on the vertical axis.
Correlation can be visualized using a scatter plot, which helps determine if a linear (straight-line) relationship exists.
Types of Correlation
Positive Linear Correlation: As x increases, y tends to increase.
Negative Linear Correlation: As x increases, y tends to decrease.
No Correlation: No apparent relationship between x and y.
Nonlinear Correlation: Relationship exists but is not linear.
Examples of Scatter Plots
GDP vs. CO2 emissions: Positive linear correlation (as GDP increases, emissions increase).
Hours exercised vs. GPA: No linear correlation (exercise does not predict GPA).
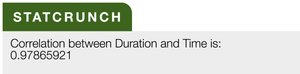
Geyser eruption duration vs. time to next eruption: Positive linear correlation (longer eruptions, longer wait times).
Correlation Coefficient
The correlation coefficient (r) measures the strength and direction of a linear relationship between two variables.
Sample correlation coefficient: r
Population correlation coefficient: \( \rho \) (rho)
Range: \( -1 \leq r \leq 1 \)
r = 1: Perfect positive correlation
r = -1: Perfect negative correlation
r ≈ 0: No linear correlation
The formula for r is:
where n is the number of data pairs.
Interpreting r
r close to 1: Strong positive correlation
r close to -1: Strong negative correlation
r close to 0: Weak or no linear correlation
Calculating the Correlation Coefficient
Calculate sums: \( \sum x, \sum y, \sum xy, \sum x^2, \sum y^2 \)
Substitute into the formula for r.
Interpret the result in context (e.g., strong positive correlation between GDP and CO2 emissions).
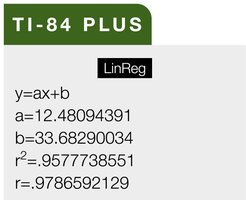
Using Technology to Calculate r
Software such as Excel, TI-84 Plus, and StatCrunch can compute r efficiently.

Testing the Significance of the Correlation Coefficient
After calculating r, we test whether the observed correlation is statistically significant for the population.
Use a critical values table (e.g., Table 11 in Appendix B) to compare the calculated r to the critical value for a given sample size (n) and significance level (\( \alpha \)).
If |r| > critical value, the correlation is significant.
Example Table: Critical Values for r
n | Critical Value (\( \alpha = 0.05 \)) |
|---|---|
5 | 0.878 |
10 | 0.632 |
25 | 0.396 |
Additional info: Values are illustrative; refer to actual statistical tables for precise values. |
Hypothesis Testing for the Population Correlation Coefficient
Null hypothesis (H0): \( \rho = 0 \) (no correlation in the population)
Alternative hypothesis (H1): \( \rho \neq 0 \) (correlation exists)
Test statistic: t, calculated as:
Degrees of freedom: n - 2
Compare t to critical values from the t-distribution for the chosen significance level.
If t falls in the rejection region, reject H0 and conclude the correlation is significant.
Correlation vs. Causation
Correlation does not imply causation. A strong correlation between two variables does not mean that one causes the other.
Possible explanations for correlation:
Direct cause-and-effect (x causes y)
Reverse cause-and-effect (y causes x)
Third variable (lurking variable) influencing both x and y
Coincidence
Lurking variables: Variables not included in the study that may affect the observed relationship.
Additional info: Understanding the distinction between correlation and causation is crucial for proper interpretation of statistical results and for avoiding erroneous conclusions in research.
