 Back
BackChapter 9: Correlation and Regression – Study Notes
Study Guide - Smart Notes
 Tailored notes based on your materials, expanded with key definitions, examples, and context.
Correlation and Regression
Introduction to Correlation
Correlation describes the relationship between two quantitative (numerical) variables. It helps us understand how one variable tends to change as the other changes. Common examples include the relationship between age and income, weight and hours of exercise, or home price and home size.
Correlation measures the degree to which two variables move together.
Variables can be positively correlated (both increase together), negatively correlated (one increases as the other decreases), or show no correlation.
Correlation does not imply causation.
Types of Correlation
Positive Linear Correlation: As one variable increases, the other also increases.
Negative Linear Correlation: As one variable increases, the other decreases.
No Correlation: No discernible pattern between the variables.
Nonlinear Correlation: The relationship exists but is not linear.
Scatter Plots
A scatter plot is a graphical tool used to visualize the relationship between two quantitative variables. Each point represents a pair of values.
Scatter plots help identify the direction, form, and strength of a relationship.
They are the first step in assessing correlation visually.
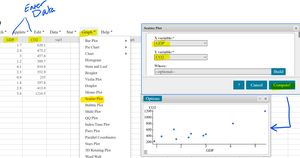
Example: Plotting GDP against CO2 emissions for multiple countries can reveal whether wealthier economies tend to emit more CO2, suggesting a positive linear correlation.
Independent and Dependent Variables
In correlation studies, variables are often classified as:
Independent variable (explanatory): The variable you suspect influences the other (plotted on the x-axis).
Dependent variable (response): The variable you suspect is influenced (plotted on the y-axis).
Example: In a study of age at heart attack (independent) and hospital stay length (dependent), we examine whether older patients tend to stay longer in the hospital.
Measuring Correlation: The Correlation Coefficient (r)
The correlation coefficient (denoted as r) is a numerical measure of the strength and direction of a linear relationship between two variables.
Range:
r > 0: Positive correlation
r < 0: Negative correlation
r = 0: No linear correlation
r = 1: Perfect positive linear correlation
r = -1: Perfect negative linear correlation
Examples:
Perfect positive:
Strong positive:
Weak positive:
No correlation:
The formula for the sample correlation coefficient is:
where is the number of data pairs. (Formula not required for most introductory courses.)

Graphical vs Algebraic Approach
Graphical Approach: Use scatter plots to visually assess correlation.
Algebraic Approach: Calculate the correlation coefficient r for a precise measure.
Population vs Sample Correlation
Population correlation coefficient: Usually denoted by the Greek letter (rho).
Sample correlation coefficient: Denoted by .
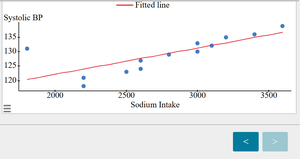
Example: Sodium Intake vs Systolic Blood Pressure
Scatter plots and fitted lines can be used to visualize the relationship between sodium intake and systolic blood pressure. A positive trend suggests that higher sodium intake is associated with higher blood pressure.
Hypothesis Testing for Correlation
Hypothesis testing allows us to determine if the observed correlation in a sample is strong enough to conclude that a true linear relationship exists in the population.
Null hypothesis (): (no linear correlation in the population)
Alternative hypothesis (): , , or (depending on the test)
Use a t-test to assess statistical significance.
The test statistic is:
where is the sample size.
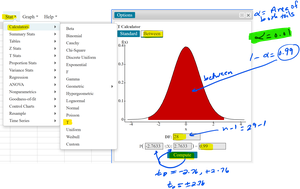
If the p-value is less than the significance level (e.g., 0.05), we reject and conclude that the correlation is statistically significant.
Example: Home Size vs Asking Price
To determine if there is a significant positive relationship between home size and asking price, data is collected and analyzed. If the test yields a significant result, we conclude that larger homes tend to have higher asking prices.
Correlation vs Causation
It is crucial to understand that correlation does not imply causation. Two variables may be strongly correlated without one causing the other.
There may be a lurking variable (an unmeasured factor) influencing both variables.
Relationships may be coincidental or due to a third factor.

Examples:
Ice cream sales and drowning rates are correlated, but both are influenced by temperature (the lurking variable).
Increased school funding and higher test scores may both be influenced by socioeconomic status.
Establishing Causation
The only way to establish a true cause-and-effect relationship is through a properly designed experiment with random assignment and controlled conditions. Observational studies can suggest associations but cannot confirm causation.
Randomized controlled trials are the gold standard for establishing causation.
Without experimental control, observed relationships may be due to chance, bias, or lurking variables.
Lurking Variables
A lurking variable is a hidden or unmeasured factor that influences both variables in a study, creating the illusion of a direct relationship.
Example: Temperature is a lurking variable that explains the correlation between ice cream sales and drowning incidents.
Summary Table: Correlation Types and Interpretation
Value of r | Interpretation |
|---|---|
1 | Perfect positive linear correlation |
0.7 to 0.9 | Strong positive linear correlation |
0.4 to 0.6 | Moderate positive linear correlation |
0.1 to 0.3 | Weak positive linear correlation |
0 | No linear correlation |
-0.1 to -0.3 | Weak negative linear correlation |
-0.4 to -0.6 | Moderate negative linear correlation |
-0.7 to -0.9 | Strong negative linear correlation |
-1 | Perfect negative linear correlation |
Additional info: These notes are based on Chapter 9 of "Elementary Statistics" and cover the essentials of correlation, scatter plots, hypothesis testing for correlation, and the distinction between correlation and causation, including the role of lurking variables.
