 Back
BackChi-Square Tests and Analysis of Variance (ANOVA): Study Notes
Study Guide - Smart Notes
 Tailored notes based on your materials, expanded with key definitions, examples, and context.
Chi-Square Tests and Analysis of Variance (ANOVA)
Chi-Square Goodness of Fit Test
The Chi-Square Goodness of Fit Test is used to determine whether observed categorical frequencies match expected frequencies based on a claimed distribution. This test is commonly applied when you want to check if a die is fair, if survey responses are equally distributed, or if real-world data follows a theoretical law (e.g., Benford's Law).
Null Hypothesis (H0): The observed frequencies match the claimed distribution.
Alternative Hypothesis (Ha): The observed frequencies do not match the claimed distribution (at least one probability is different).
Test Statistic: Where O = observed frequency, E = expected frequency.
Expected Frequency (Uniform): Where n = total sample size, k = number of categories.
Degrees of Freedom:
P-value: Area to the right of the calculated value in the chi-square distribution with the appropriate degrees of freedom.
Decision: If p-value < significance level (), reject H0.
Example: Testing if a die is fair by rolling it 60 times and comparing observed frequencies to the expected frequency for each face (10 if fair).
Goodness of Fit Test: Unequal Probabilities
When the claimed probabilities are not equal, expected frequencies are calculated using the given probabilities for each category:
Expected Frequency (Non-uniform): Where p = claimed probability for the category.
Example: Testing if the first digits of city populations follow Benford's Law, where each digit has a specific probability.
Goodness of Fit Test Using Technology (TI-84)
Statistical calculators like the TI-84 can perform the Goodness of Fit Test efficiently. Data is entered into lists (L1 for observed, L2 for expected), and the test is run using the appropriate function.
Steps: Enter observed and expected frequencies, select the chi-square GOF test, and interpret the output (test statistic, p-value, conclusion).
Contingency Tables and Expected Frequencies
A contingency table displays the frequency distribution of variables that are categorical. Expected frequencies for each cell (assuming independence) are calculated as:
Example: Calculating expected frequencies for a drug trial with improvement and placebo/non-placebo groups.
Chi-Square Test of Independence
The Chi-Square Test of Independence determines whether two categorical variables are independent. It uses the same test statistic as the goodness of fit test but is applied to contingency tables.
Null Hypothesis (H0): The variables are independent.
Alternative Hypothesis (Ha): The variables are dependent.
Degrees of Freedom: , where r = number of rows, c = number of columns.
Example: Testing if symptom improvement is independent of receiving a placebo.

Chi-Square Test of Homogeneity
The Test of Homogeneity is used to determine if different populations have the same proportion of a characteristic. The procedure is mathematically identical to the test of independence but with different hypotheses.
Null Hypothesis (H0): All populations have the same proportion of the characteristic.
Alternative Hypothesis (Ha): At least one population has a different proportion.
Example: Testing if car ownership rates are the same for teens and adults.
One-Way ANOVA (Analysis of Variance)
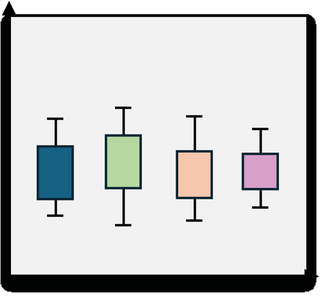
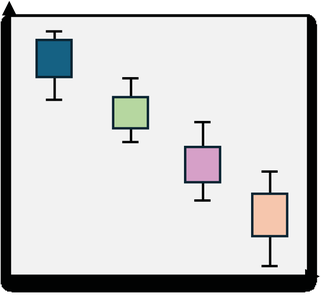
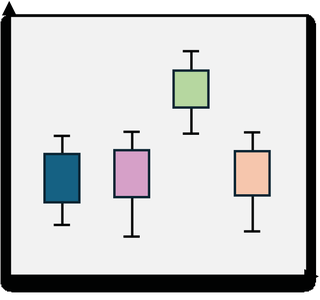
One-Way ANOVA is used to compare the means of three or more groups to determine if at least one mean is different. It analyzes variance between groups and within groups.
Null Hypothesis (H0): All group means are equal ().
Alternative Hypothesis (Ha): At least one group mean is different.
Test Statistic:
Degrees of Freedom:
Between:
Within:
Example: Comparing average study times across grades 10, 11, and 12.

Post-Hoc Tests: Tukey, Tukey-Kramer, and Bonferroni
If ANOVA indicates at least one mean is different, post-hoc tests identify which means differ. Common tests include:
Tukey Test: Compares all possible pairs of means. Test statistic:
Tukey-Kramer Test: Used when group sizes are unequal:
Bonferroni Test: Adjusts the significance level for multiple comparisons. Multiply the p-value by the number of comparisons.
Example: Comparing mean weight loss across three diet plans after ANOVA shows a difference.

Two-Way ANOVA
Two-Way ANOVA is used to analyze the effect of two independent variables (factors) on a dependent variable, and to test for interaction effects between the factors.
Interaction Effect: Occurs if the effect of one factor depends on the level of the other factor.
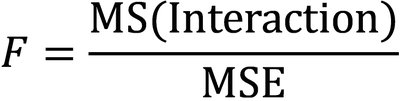
Test Statistics: and
Interpretation: Test for interaction first. If significant, interpret with caution; if not, test main effects.
Example: Testing how sunlight and fertilizer affect plant growth, and whether their effects interact.


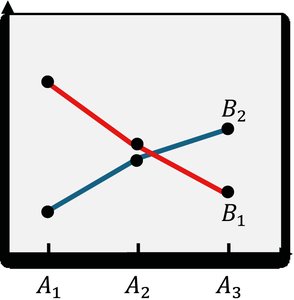
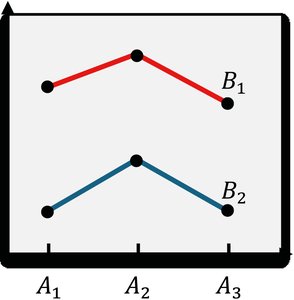
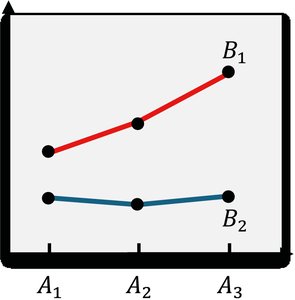
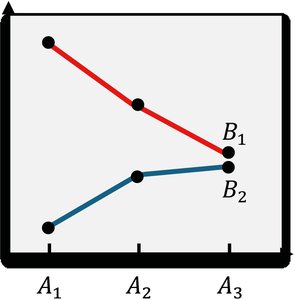
Two-Way ANOVA: Interaction Plots
Interaction plots graphically display means for combinations of two factors. If lines are not parallel, this suggests an interaction effect.
No Interaction: Lines are roughly parallel.
Interaction: Lines cross or diverge/converge.
Example: Plotting exam scores by study time and hours of sleep to check for interaction.
Summary Table: Chi-Square and ANOVA Tests
Test | Purpose | Hypotheses | Test Statistic | df |
|---|---|---|---|---|
Chi-Square Goodness of Fit | Compare observed to expected frequencies | H0: Observed = Expected Ha: Observed ≠ Expected | k-1 | |
Chi-Square Independence | Test independence of two variables | H0: Variables independent Ha: Variables dependent | (r-1)(c-1) | |
One-Way ANOVA | Compare means of 3+ groups | H0: All means equal Ha: At least one mean differs | k-1, N-k | |
Two-Way ANOVA | Compare means across 2 factors, test interaction | H0: No effect/interaction Ha: Effect/interaction present | Depends on factors/groups |
