 Back
BackChapter 10- Chi-Square Tests and One-Way ANOVA: Study Notes
Study Guide - Smart Notes
 Tailored notes based on your materials, expanded with key definitions, examples, and context.
Chi-Square Tests
Chi-Square Goodness-of-Fit Test
The chi-square goodness-of-fit test is used to determine whether the observed frequencies in categorical data match expected frequencies derived from a specific hypothesis. This test is commonly applied when assessing whether a sample distribution fits a theoretical distribution.
Observed Frequencies (O): The actual counts obtained from the sample.
Expected Frequencies (E): The counts expected under the null hypothesis, often based on equal proportions or known population proportions.
Example: Suppose a survey of 200 students yields the following distribution by year:
First year: 60
Second year: 45
Third year: 52
Fourth year: 43
If equal representation is expected (50 per year), the test evaluates whether the observed distribution significantly deviates from this expectation.
Hypotheses
Null hypothesis (H0): O = E (Observed frequencies match expected frequencies)
Alternative hypothesis (Ha): O ≠ E (Observed frequencies differ from expected frequencies)
Test Statistic
The test statistic is calculated as:
where O is the observed frequency and E is the expected frequency for each category.
Degrees of Freedom
The degrees of freedom (df) for the test is:
where k is the number of categories.
Decision Rule
Choose a significance level (α), commonly 0.05.
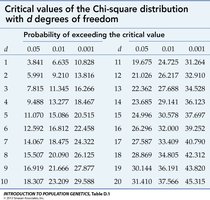
Compare the calculated value to the critical value from the chi-square distribution table with the appropriate degrees of freedom.
If is greater than the critical value, reject H0.
Conditions for Validity
Observed frequencies must be from a random sample.
Each expected frequency should be at least 5.
Summary Table: Steps in the Chi-Square Goodness-of-Fit Test
Verify random sampling and minimum expected frequency.
State the hypotheses (H0 and Ha).
Specify the significance level (α).
Calculate the test statistic .
Determine the degrees of freedom and critical value.
Compare to the critical value and make a decision.
Interpret the result in context.
Chi-Square Test of Independence
The chi-square test of independence is used to determine whether two categorical variables are independent in a population. Data are organized in a contingency table (cross-tabulation).
Null hypothesis (H0): The variables are independent.
Alternative hypothesis (Ha): The variables are not independent.
Expected frequency for each cell:
Degrees of freedom:
The test statistic is calculated as in the goodness-of-fit test, and the decision is made by comparing to the critical value from the chi-square table.
Analysis of Variance (ANOVA)
Introduction to ANOVA
Analysis of Variance (ANOVA) is a statistical method used to compare means across three or more groups. The one-way ANOVA tests whether there are significant differences among group means by analyzing the variance within and between groups.
Factor: The independent variable (e.g., teaching method).
Levels: The different groups or categories of the factor.
ANOVA is preferred over multiple t-tests to control the overall Type I error rate.
Assumptions of One-Way ANOVA
Each sample is randomly selected from a normal (or approximately normal) population.
Samples are independent of each other.
Population variances are equal (homogeneity of variance).
Steps in Performing a One-Way ANOVA
Verify assumptions (randomness, normality, equal variances).
State the hypotheses:
H0: All group means are equal ()
Ha: At least one group mean differs
Specify the significance level (α).
Calculate the test statistic (F):
Find the mean and variance of each sample.
Find the grand mean (mean of all data).
Compute the sum of squares between groups () and within groups ().
Calculate mean squares:
Compute the F statistic:
Determine the degrees of freedom:
Numerator:
Denominator:
Compare the calculated F to the critical value from the F-distribution table.
Make a decision and interpret the result in context.
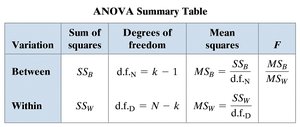
ANOVA Summary Table
The ANOVA summary table organizes the calculations and results for the one-way ANOVA test:
Variation | Sum of squares | Degrees of freedom | Mean squares | F |
|---|---|---|---|---|
Between | ||||
Within |
Additional info: The F-test in ANOVA is always right-tailed, and a significant result indicates that at least one group mean is different, but post-hoc tests are needed to determine which groups differ.
