 Back
BackComparing Means for Independent Samples: Two-Sample t-Tests and Pooled t-Tests
Study Guide - Smart Notes
 Tailored notes based on your materials, expanded with key definitions, examples, and context.
Comparing Means for Independent Samples
Introduction to Comparing Two Population Means
In statistics, comparing two population means is a common task, especially when evaluating the effect of treatments or differences between groups. The primary focus is on the difference between the means, and statistical inference is used to determine if this difference is significant.
Population Parameters: The means, proportions, or standard deviations of two populations.
Statistical Inference: If the observed difference is large enough, we infer a true difference exists.
Applications: Medical studies, product comparisons, experimental research, etc.
Types of Sampling: Independent vs. Dependent
Independent and Dependent Sampling
The method of sampling determines the appropriate statistical test. Understanding the distinction between independent and dependent samples is crucial.
Independent Sampling: Selection of individuals in one group does not affect the selection in the other group. Test Used: Two-sample t-test.
Dependent Sampling (Matched Pairs): Selection in one group influences the other (e.g., repeated measures on the same subjects). Test Used: Paired t-test (covered in another chapter).
Example of Independent Sampling: Randomly assigning subjects to a treatment or control group in a clinical trial.
Example of Dependent Sampling: Measuring the same individual's response before and after a treatment.
Examples: Shoe Size Study
Method 1 (Dependent): Measure both left and right feet of the same 60 adults.
Method 2 (Independent): Measure left feet of one group and right feet of a different group.
Best Practice: Dependent sampling (Method 1) is more appropriate for comparing left and right foot lengths within individuals.
Visualizing and Summarizing Data
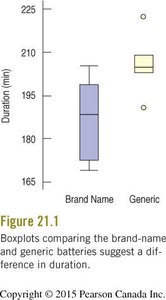
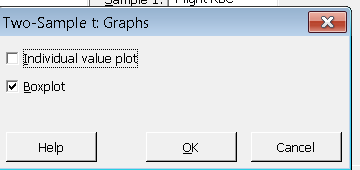
Boxplots for Comparing Groups
Boxplots are a natural way to visually compare two independent groups. They provide insights into the central tendency, spread, and potential outliers.
Side-by-side Boxplots: Allow for visual comparison of medians, interquartile ranges, and outliers.
Distribution Check: If the distribution is in doubt, use normality tests (e.g., Ryan-Joiner test).
Statistical Inference for Two Means
Parameter and Statistic of Interest
The main parameter of interest is the difference between the two population means (). The statistic of interest is the difference between the two sample means ().
Standard Error of the Difference
When samples are independent, the variance of the difference is the sum of the variances. The standard error (SE) is estimated using sample standard deviations:
Standard Error Formula:
Confidence Interval for the Difference
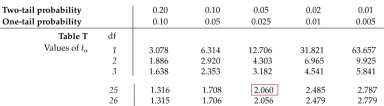
The confidence interval for the difference in means uses the Student's t-distribution:
Two-sample t-interval: Used for the difference in means.
Degrees of Freedom (df): Calculated using a complex formula, but typically determined by statistical software.
Hypothesis Testing for Two Means
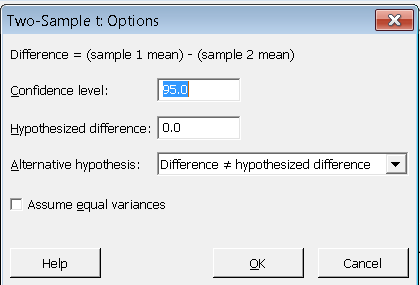
To test if there is a significant difference between two means, set up hypotheses:
Null Hypothesis: (no difference)
Alternative Hypothesis: , , or (depending on the research question)
Test Statistic:
Assumptions: Independent random samples, each group is nearly normally distributed.
Assumptions and Conditions
Key Assumptions for Two-Sample t-Test
Independence: Observations within and between groups must be independent.
Randomization: Data should be collected using random sampling or random assignment.
Normality: Each group should be nearly normally distributed (check with normality tests or boxplots).
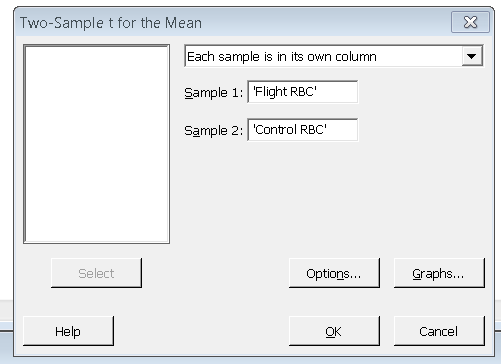
Worked Example: Red Blood Cells in Space Rats
Problem Setup
Comparing the mean red blood cell (RBC) mass between rats sent to space and a control group. Both groups have 14 rats each.
Step 1: Check for independence and normality (boxplots and RJ-tests confirm normality).
Step 2: Set up hypotheses: ,
Step 3: Calculate test statistic and p-value using the two-sample t-test.
Step 4: Interpret results: If p-value > 0.05, fail to reject ; if CI contains 0, no significant difference.
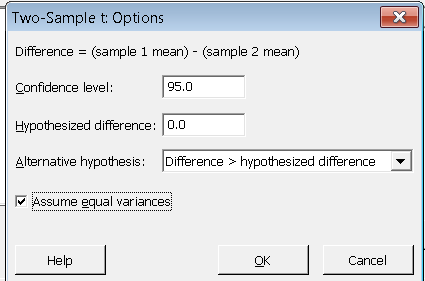
Pooled t-Test for Equal Variances
When to Use the Pooled t-Test
The pooled t-test is used when the variances of the two groups are assumed to be equal. This assumption should be checked with boxplots or formal tests (e.g., F-test), but the F-test is sensitive to non-normality.
Pooled Variance Formula:
Standard Error (Pooled):
Degrees of Freedom:
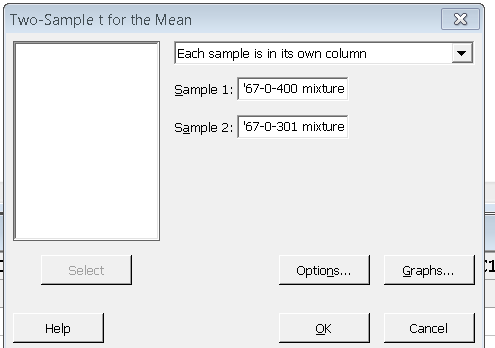
Example: Concrete Breaking Strength
Comparing the breaking strength of two concrete mixtures using both pooled and unpooled t-tests. The results are nearly identical, but the degrees of freedom differ slightly.
Conclusion: If p-value < 0.05, reject and conclude a significant difference exists.
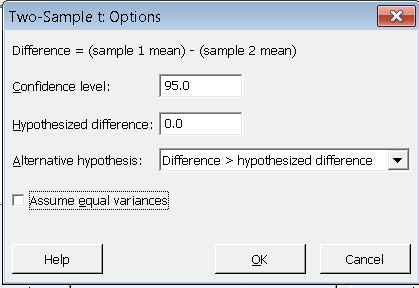
Interpretation: The pooled method is only appropriate when variances are equal; otherwise, use the unpooled method.
Determining Sample Size
Sample Size for Estimating Difference in Means
To estimate the difference in two means with a specified margin of error (ME) and confidence level, use:
Inputs Needed: Desired margin of error, confidence level, and estimates of standard deviations.
Common Pitfalls and Best Practices
Do not use two-sample methods for dependent samples.
Always check assumptions (independence, normality, equal variances if pooling).
Use visualizations (boxplots) to check for outliers and distribution shape.
Randomization is essential for valid inference.
Summary of Key Points
Know how to construct and interpret two-sample t-intervals and t-tests for independent groups.
Understand the assumptions and when to use pooled vs. unpooled methods.
Recognize the importance of independence and normality for valid inference.
Use statistical software for complex calculations (e.g., degrees of freedom).
