 Back
BackComparing Three or More Means: One-Way ANOVA and Block Designs
Study Guide - Smart Notes
 Tailored notes based on your materials, expanded with key definitions, examples, and context.
Comparing Three or More Means
One-Way Analysis of Variance (ANOVA)
One-way ANOVA is an inferential statistical method used to test the equality of three or more population means. It is a fundamental technique for determining whether differences exist among group means in a sample.
Key Point 1: Do not conduct multiple pairwise tests (e.g., three separate t-tests for three means), as this increases the probability of a Type I error beyond the nominal significance level, α.
Key Point 2: ANOVA Requirements:
There must be k simple random samples from k populations or treatments.
The samples must be independent of each other.
The populations must be normally distributed.
The populations must have equal variances (homoscedasticity).
Example: Testing the mean weights of pennies minted in 1990, 1995, and 2000.

Hypothesis Testing in One-Way ANOVA
The null hypothesis in one-way ANOVA is that all population means are equal: . The alternative hypothesis is that at least one mean is different.
Key Point: The test compares between-sample variability to within-sample variability.
Decision Rule: If the between-sample variability is large relative to the within-sample variability, we reject the null hypothesis.

Verifying ANOVA Assumptions
Before performing ANOVA, verify the assumptions:
Normality: Use normal probability plots to check if data are approximately normal.
Equal Variances: The largest sample standard deviation should not be more than twice the smallest.


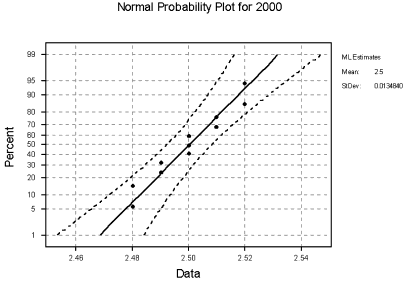
Example: For penny weights, the normality and equal variance assumptions are satisfied.
ANOVA F-Test Statistic and Formulas
The F-test statistic in ANOVA is calculated as the ratio of the mean square due to treatments (MST) to the mean square due to error (MSE):
Formula:
Mean Square Due to Treatments:
Mean Square Due to Error:
Sum of Squares Due to Treatments:
Sum of Squares Due to Error:
ANOVA Table
The ANOVA table summarizes the sources of variation, sum of squares, degrees of freedom, mean squares, and the F-test statistic.
Source of Variation | Sum of Squares | Degrees of Freedom | Mean Squares | F-Test Statistic |
|---|---|---|---|---|
Treatment | 0.0009 | 2 | 0.0005 | 1.25 |
Error | 0.013 | 30 | 0.0004 | |
Total | 0.0139 | 32 |
Decision Rules in ANOVA
Classical Method: If , reject .
P-value Method: If the P-value is less than α, reject .
Post Hoc Tests: Tukey's Test
Multiple Comparisons After ANOVA
When ANOVA indicates at least one mean is different, post hoc tests such as Tukey's test are used to determine which means differ significantly.
Key Point: Tukey's test compares all possible pairs of means while controlling the familywise error rate.
Standard Error for Tukey's Test:
Test Statistic:
Critical Value: from the Studentized range distribution, where ν is the error degrees of freedom and k is the number of means.
Steps for Tukey's Test
Arrange sample means in ascending order.
Compute pairwise differences.
Compute the test statistic for each pair.
Determine the critical value .
If , reject for that pair.
Identify which means differ.
Randomized Complete Block Design
Block Design in ANOVA
Blocking is a method for controlling experimental error by grouping similar experimental units. The randomized complete block design is used when a nuisance variable (e.g., age, gender) may affect the response variable.
Key Point: Blocks should form homogenous groups to reduce mean square error.
Requirements:
The response variable for each population is normally distributed.
The response variable for each population has the same variance.
Example: Testing the effect of four fertilizers on fruiting period, blocking by row.
ANOVA Table for Block Design
Source | DF | SS | MS | F | P |
|---|---|---|---|---|---|
Fertilizer | 3 | 17.885 | 5.96167 | 22.40 | 0.000 |
Row | 3 | 24.110 | 8.03667 | 30.20 | 0.000 |
Error | 9 | 2.395 | 0.26611 | ||
Total | 15 | 44.390 |
Post Hoc Comparisons in Block Design
After rejecting the null hypothesis, Tukey's test is used to identify which means differ significantly. The steps are identical to those in one-way ANOVA, but the error degrees of freedom are calculated as , where r is the number of blocks and c is the number of treatments.
Example: Tukey Simultaneous Tests for Fertilizer Means
Fertilizer Pair | Difference of Means | SE of Difference | T-Value | Adjusted P-Value |
|---|---|---|---|---|
1 vs 2 | 0.4000 | 0.3648 | 1.097 | 0.7003 |
1 vs 3 | 1.4750 | 0.3648 | 4.044 | 0.0127 |
1 vs 4 | 2.7250 | 0.3648 | 7.471 | 0.0002 |
2 vs 3 | 1.075 | 0.3648 | 2.947 | 0.0650 |
2 vs 4 | 2.325 | 0.3648 | 6.374 | 0.0006 |
3 vs 4 | 1.250 | 0.3648 | 3.427 | 0.0316 |
Conclusion: Means with adjusted P-values less than 0.05 are significantly different.
