 Back
BackComparing Two Proportions: Confidence Intervals and Hypothesis Testing
Study Guide - Smart Notes
 Tailored notes based on your materials, expanded with key definitions, examples, and context.
Comparing Two Proportions
Introduction to Comparing Two Proportions
Comparing two proportions is a fundamental task in statistics, especially when evaluating differences between groups, treatments, or time periods. This analysis helps determine whether observed differences are statistically significant or could have occurred by random chance.
Key Application: Used to compare the effectiveness of treatments, survey results across groups, or changes over time.
Examples: Comparing the proportion of patients experiencing side effects in treatment vs. control groups, or the proportion of males vs. females meeting dietary recommendations.
Sampling Distribution of the Difference Between Two Proportions
Normal Model for the Difference
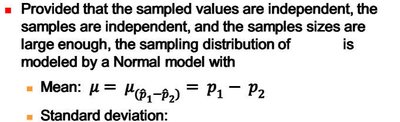
Provided that the sampled values are independent, the samples are independent, and the sample sizes are large enough, the sampling distribution of the difference in sample proportions is modeled by a Normal model with:
Mean:
Standard Deviation:
Standard Error (when population proportions are unknown):
Assumptions and Conditions
Requirements for Valid Inference
Independence Assumptions:
Randomization Condition: Data in each group must be drawn independently and at random from a homogeneous population or generated by a randomized comparative experiment.
10% Condition: If sampling without replacement, the sample size should not exceed 10% of the population.
Independent Groups Assumption: The two groups being compared must be independent of each other.
Sample Size Condition: Each group must be large enough to satisfy the Success/Failure Condition.
Success/Failure Condition: Both groups must have at least 10 observed successes and 10 observed failures:
and
and
Confidence Interval for the Difference Between Two Proportions
Constructing the Confidence Interval
When the above conditions are met, the confidence interval for the difference between two proportions is:
The critical value depends on the desired confidence level (e.g., 1.96 for 95% confidence).
Interpretation: If the confidence interval contains only positive values, is significantly greater than . If it contains only negative values, $p_1$ is significantly less than $p_2$. If it contains zero, there is no significant difference.
Hypothesis Testing for the Difference Between Two Proportions
Two-Proportion z-Test
The two-proportion z-test is used to test the null hypothesis (no difference between proportions). The test statistic is:
Where the pooled proportion is
Pooled standard error:
Compare the calculated z-value to the standard normal distribution to obtain the p-value. If the p-value is less than the significance level , reject the null hypothesis.
Types of Tests
Alternative Hypotheses
Upper-tailed test:
Lower-tailed test:
Two-tailed test:
Example: Nasonex Clinical Trial
Testing for Difference in Proportions
In a clinical trial, 2103 patients received Nasonex (experimental group) and 1671 received a placebo (control group). 547 in the experimental group and 368 in the control group reported headaches.
Sample proportions: ,
Pooled proportion:
Test statistic:
P-value:
Conclusion: Since p-value < 0.05, reject . There is significant evidence that the rate of headaches is higher in the Nasonex group.
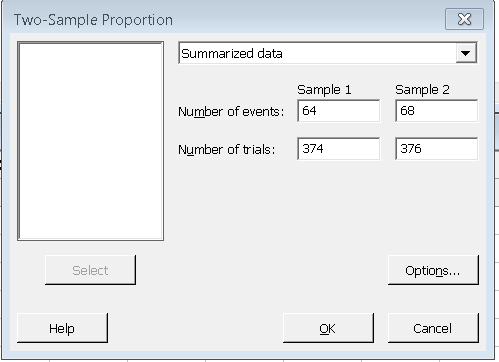
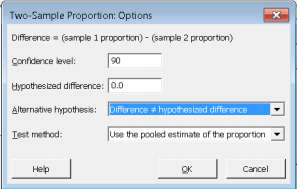
Example: Confidence Interval for Difference
Pediatric Nasonex Trial
374 pediatric patients received Nasonex, 376 received placebo. 64 and 68 reported headaches, respectively.
Sample proportions: ,
90% Confidence Interval:
Interpretation: Since the interval contains 0, there is no significant difference in headache rates between groups at the 10% significance level.
Sample Size Determination
Calculating Required Sample Size
To achieve a desired margin of error (ME) for a confidence interval for :
If no prior estimates, use for a conservative estimate.
Example: To estimate the difference in calcium intake proportions within 3 percentage points (ME = 0.03) at 95% confidence, with prior estimates , , the required sample size is approximately 1863 per group. Without prior estimates, use 2135 per group.
Common Pitfalls
Do not use two-sample proportion methods if samples are not independent.
Randomization is essential for valid inference.
Significant differences do not imply causality unless the study is a randomized experiment.
These methods are not appropriate for paired or matched data.
Summary
Know how to construct and interpret confidence intervals for the difference between two proportions.
Check all assumptions and conditions before making inferences.
Be able to perform and interpret a two-sample proportions test.
Understand the importance of independence and randomization in study design.
