 Back
BackComprehensive Statistics Exam 1 Review – Step-by-Step Guidance
Study Guide - Smart Notes
 Tailored notes based on your materials, expanded with key definitions, examples, and context.
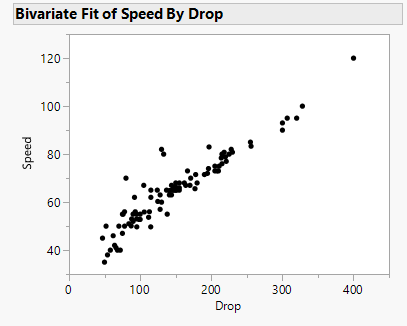
Q1. Scatterplot of Rollercoaster Drop vs. Speed
Background
Topic: Correlation and Scatterplots
This question tests your understanding of how to interpret scatterplots, the direction of relationships, and the conditions for correlation.
Key Terms and Formulas:
Correlation (r): Measures the strength and direction of a linear relationship between two quantitative variables.
Scatterplot: A graph that shows the relationship between two quantitative variables.
Conditions for Correlation: 1) Quantitative Variables, 2) Linear Relationship, 3) No Strong Outliers
Step-by-Step Guidance
Look at the overall pattern of the scatterplot. Does the data trend upward (positive), downward (negative), or is there no clear trend?
Recall the three conditions for correlation: (1) Both variables must be quantitative, (2) The relationship should be roughly linear, (3) There should be no strong outliers.
For each condition, check if the scatterplot meets it. For example, are both variables numbers? Does the pattern look like a straight line? Are there any points far away from the rest?
Think about what would happen to the correlation coefficient (r) if you added a point with Drop = 250 ft and Speed = 50 mph. Would this point fit the pattern, or would it be an outlier?
Try solving on your own before revealing the answer!
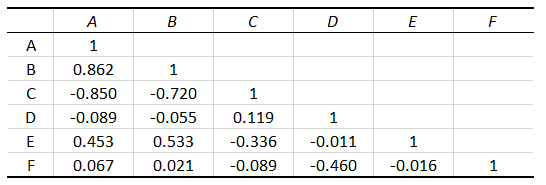
Q2. Interpreting a Correlation Matrix
Background
Topic: Correlation Matrix Interpretation
This question tests your ability to read a correlation matrix and identify the strongest/weakest and positive/negative relationships between variables.
Key Terms and Formulas:
Correlation Coefficient (r): Ranges from -1 (perfect negative) to +1 (perfect positive).
Strongest/Weakest Correlation: The value of r closest to +1 or -1 is strongest; closest to 0 is weakest.
Step-by-Step Guidance
Scan the matrix for the largest positive value (excluding 1s on the diagonal) to find the strongest positive correlation.
Find the smallest positive value (closest to zero but still positive) for the weakest positive correlation.
Look for the most negative value for the strongest negative correlation, and the negative value closest to zero for the weakest negative correlation.
For overall strongest/weakest, compare the absolute values of all off-diagonal entries.
Think about what information is missing from a correlation matrix (e.g., sample size, context, or scatterplots).
Try solving on your own before revealing the answer!
Q3. Normal Model for Car Speeds on Cumberland Avenue
Background
Topic: Normal Distribution, Z-scores, and the Empirical Rule
This question tests your ability to calculate z-scores, interpret them, and use the normal model to estimate probabilities and percentiles.
Key Terms and Formulas:
Z-score:
Empirical Rule (68-95-99.7 Rule): About 68% of data falls within 1 SD, 95% within 2 SD, 99.7% within 3 SD of the mean.
Step-by-Step Guidance
For the speed limit (25 mph), calculate the z-score using the mean (22.53 mph) and standard deviation (2.47 mph).
To find the percent of cars over the speed limit, use the z-score and a standard normal table or calculator to find the area to the right.
For a car at 28 mph, calculate its z-score and compare it to typical cutoffs for "unusual" (e.g., |z| > 2).
For the percent of cars at 28 mph or slower, use the empirical rule to estimate the interval and fill in the blanks for the percent range.
Try solving on your own before revealing the answer!
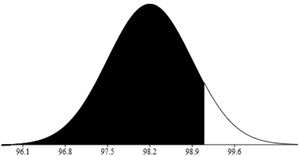
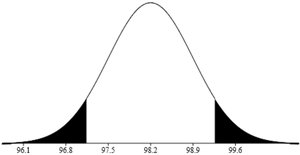
Q4. Body Temperature and the Normal Model
Background
Topic: Normal Distribution, Percentiles, and Z-scores
This question tests your ability to use the normal model to find probabilities, percentiles, and interpret z-scores for body temperature data.
Key Terms and Formulas:
Z-score:
Percentile: The percentage of data below a certain value.
Step-by-Step Guidance
To find the percent below 97.14°F, calculate the z-score and use a normal table or calculator to find the area to the left.
For a z-score of 1.286, find the area to the right (greater than this z-score).
To find the percent between 98.2°F and 99.26°F, calculate the z-scores for both values and find the area between them.
To find the 20th percentile, use the z-score corresponding to the 20th percentile and solve for the temperature value.
Try solving on your own before revealing the answer!
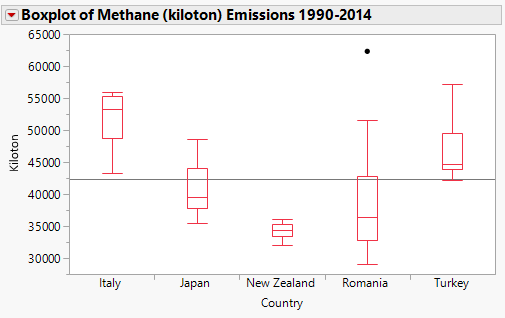
Q5. Boxplots of Methane Emissions
Background
Topic: Boxplots, Five-Number Summary, and Distribution Shape
This question tests your ability to interpret boxplots, compare medians, identify skewness, and estimate quartiles.
Key Terms and Formulas:
Median: The middle value of a data set.
Quartiles (Q1, Q3): Values that divide the data into quarters.
Skewness: If the box is longer on one side or the whisker is longer, the data is skewed in that direction.
Step-by-Step Guidance
Compare the medians (lines inside the boxes) for each country to determine which is highest.
Look at the shape of Romania's boxplot: is the box or whisker longer on one side? That indicates skewness.
Read each statement and use the boxplot to check if it is true or false.
Estimate the 75th percentile (Q3) for Japan and Q1 for Romania by looking at the top and bottom of the boxes.
Try solving on your own before revealing the answer!
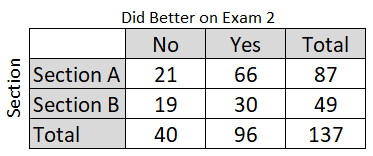
Q6. JMP Output: Exam Performance by Section
Background
Topic: Two-Way Tables and Proportions
This question tests your ability to interpret a contingency table and calculate proportions for different groups.
Key Terms and Formulas:
Proportion:
Contingency Table: A table showing the frequency distribution of variables.
Step-by-Step Guidance
For each section, divide the number who did better on Exam 2 (or Exam 1) by the total in that section.
For the overall percent, divide the total who did better on Exam 2 by the grand total.
Think about which visual tool (e.g., bar chart, segmented bar chart) would best show differences between sections.
Try solving on your own before revealing the answer!
Q7. Calculating Summary Statistics for a List of Numbers
Background
Topic: Measures of Center and Spread
This question tests your ability to calculate the mean, median, quartiles, and interquartile range (IQR) for a data set.
Key Terms and Formulas:
Mean:
Median: The middle value when data is ordered.
Quartiles (Q1, Q3): Values that split the ordered data into quarters.
IQR:
Step-by-Step Guidance
Order the numbers from smallest to largest.
Calculate the mean by adding all values and dividing by the count.
Find the median (middle value), Q1 (median of lower half), and Q3 (median of upper half).
Subtract Q1 from Q3 to find the IQR.
Try solving on your own before revealing the answer!
Q8. Data Types and Graphical Displays
Background
Topic: Types of Data and Appropriate Graphs
This question tests your understanding of which graphs are appropriate for quantitative vs. categorical data, and which visualizations match variable combinations.
Key Terms and Formulas:
Univariate: One variable (quantitative or categorical).
Bivariate: Two variables (can be both quantitative, both categorical, or one of each).
Step-by-Step Guidance
For each graph type, decide if it is used for quantitative or categorical data.
For bivariate visualizations, match the graph to the correct variable combination (e.g., scatterplot for two quantitative variables).
Try solving on your own before revealing the answer!
Q9. True/False and Symbol Table
Background
Topic: Statistical Concepts and Notation
This section tests your understanding of key statistical concepts (e.g., simulation, inference, correlation, outliers, z-scores, normal probability plots) and your ability to match symbols to their statistical meaning.
Key Terms and Formulas:
Population Parameter: Usually denoted by Greek letters (e.g., , ).
Sample Statistic: Usually denoted by Latin letters (e.g., , ).
Correlation Coefficient:
Z-score:
Step-by-Step Guidance
Read each statement carefully and recall the definition or property it refers to.
For the symbol table, match each statistical concept to its correct symbol.
Try solving on your own before revealing the answer!
