 Back
Comprehensive Step-by-Step Guidance for STAT C1000 Review Exam #2
Study Guide - Smart Notes
 Tailored notes based on your materials, expanded with key definitions, examples, and context.
Q1. Determine the regression equation for the given data set.
Background
Topic: Least Squares Regression Line
This question tests your ability to calculate the regression equation (line of best fit) for a set of paired data using the least squares method.
Key Terms and Formulas:
Regression Equation:
Slope:
Y-intercept:
Step-by-Step Guidance
List the values for and from the data set.
Calculate , , , and .
Plug these sums into the formulas for and to set up the regression equation.
Check your calculations for accuracy before proceeding to the final computation.
Try solving on your own before revealing the answer!
Final Answer:
Using the formulas and plugging in the calculated sums, the regression equation is .
This equation models the relationship between and in the data set.
Q2. Find the correlation coefficient for the data.
Background
Topic: Correlation Coefficient
This question tests your ability to calculate the linear correlation coefficient (), which measures the strength and direction of the linear relationship between two variables.
Key Terms and Formulas:
Correlation Coefficient:
Step-by-Step Guidance
Calculate , , , , and from the data.
Plug these values into the formula for to set up the calculation.
Carefully compute the numerator and denominator separately.
Check your setup before completing the calculation.
Try solving on your own before revealing the answer!
Final Answer:
The calculated correlation coefficient is , indicating a very strong positive linear relationship between and .
Q3. Based on the correlation coefficient , does a linear relation exist between years of service and average monthly sales?
Background
Topic: Statistical Significance of Correlation
This question tests your ability to interpret the correlation coefficient and determine if it is statistically significant using critical values from a table.
Key Terms and Formulas:
Correlation Coefficient (): Measures strength and direction of linear relationship.
Critical Value: The minimum value must exceed to be considered significant.
Step-by-Step Guidance
Identify the sample size () from the data.
Find the critical value for from Table VI for the given .
Compare the given to the critical value.
Decide if is large enough to indicate a significant linear relationship.
Try solving on your own before revealing the answer!
Final Answer: No, a linear relation does not exist.
The correlation coefficient does not exceed the critical value for the sample size, so the relationship is not statistically significant.
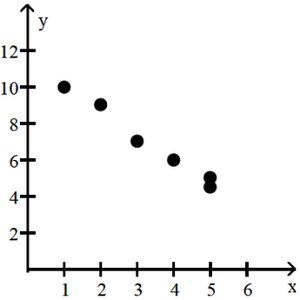
Q4. Based strictly on the scatterplot, determine the strength and direction of the association between and .
Background
Topic: Visual Interpretation of Scatterplots
This question tests your ability to visually assess the strength and direction of the relationship between two variables using a scatterplot.
Key Terms:
Positive Association: As increases, increases.
Negative Association: As increases, decreases.
Strength: Strong, moderate, or weak relationship based on how closely points follow a line.
Step-by-Step Guidance
Examine the scatterplot to see if the points trend upward or downward.
Assess how closely the points follow a straight line (tight clustering indicates strong association).
Determine if the association is positive or negative based on the direction.
Decide if the relationship is strong or moderate.
Try solving on your own before revealing the answer!
Final Answer: The variables appear to have a negative and very strong relation.
The scatterplot shows a strong negative association, as the points closely follow a downward trend.
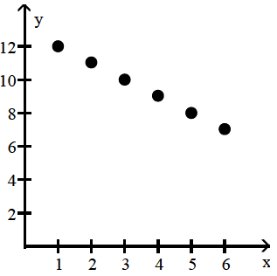
Q5. In which scatter diagram is ?
Background
Topic: Visual Representation of Correlation
This question tests your ability to match a correlation coefficient to a scatterplot based on the strength and direction of the relationship.
Key Terms:
Correlation Coefficient (): Negative values indicate negative association; values close to -1 indicate strong negative association.
Step-by-Step Guidance
Review each scatter diagram for the direction (positive or negative) and strength (tightness of clustering).
Identify which diagram shows a strong negative linear relationship.
Match the diagram to the value (strong negative).
Confirm your choice by comparing with other diagrams.
Try solving on your own before revealing the answer!
Final Answer: Diagram D
Diagram D shows a strong negative linear relationship, which matches .
