 Back
BackComprehensive Study Guide for Introductory Statistics Final Exam
Study Guide - Smart Notes
 Tailored notes based on your materials, expanded with key definitions, examples, and context.
Introduction to Data
Populations, Samples, Parameters, and Statistics
Understanding the basic elements of a statistical study is essential for interpreting results and designing experiments.
Population: The entire group of individuals or objects of interest.
Sample: A subset of the population selected for study.
Parameter: A numerical summary describing a characteristic of the population.
Statistic: A numerical summary describing a characteristic of the sample.
Observational Units: The individual entities on which measurements are taken.
Bias: Systematic error introduced by the sampling method, leading to non-representative results.
Example: In a study of college students' test scores, the population is all college students, the sample is the group surveyed, the parameter is the average score of all students, and the statistic is the average score of the sample.
Picturing Variation with Graphs
Observational and Experimental Studies
Statistical studies can be classified as observational or experimental, each with distinct features and purposes.
Observational Study: Researchers observe subjects without intervention.
Experimental Study: Researchers manipulate variables to observe effects.
Key Components of Experimental Design:
Treatment: The condition applied to subjects.
Factor of Interest (Explanatory Variable): The variable manipulated by the researcher.
Response Variable (Dependent Variable): The outcome measured.
Nuisance Factors: Variables that may affect the response but are not of primary interest.
Random Assignment: Allocating subjects to treatments randomly to reduce bias.
Replication: Repeating the experiment to ensure reliability.
Example: Testing a new drug by randomly assigning patients to treatment and control groups is an experimental study.
Numerical Summaries of Center and Variation
Describing Distributions
Statistical distributions are characterized by their shape, center, spread, and presence of outliers.
Shape: Describes the form of the distribution (e.g., symmetric, skewed).
Center: Measures include mean and median.
Spread: Measures include range, interquartile range (IQR), and standard deviation.
Outliers: Data points that are significantly different from others.
Connection between Mean and Median: In symmetric distributions, mean ≈ median; in skewed distributions, they differ.
Example: A histogram showing test scores may reveal a symmetric distribution with a mean and median near each other.
Regression Analysis: Exploring Associations between Variables
Bivariate Data and Linear Regression
Regression analysis explores relationships between two quantitative variables.
Trend: Direction and strength of association between variables.
Correlation Coefficient (r): Measures linear association; ranges from -1 to 1.
Estimated Slope and Y-Intercept: Parameters of the line of best fit.
Prediction: Using the regression equation to estimate values.
Example: Predicting a student's final grade based on hours studied using a regression line.
Modeling Variation with Probability
Probability Concepts
Probability models describe the likelihood of events and relationships between them.
Probability of Events: Calculating the chance of one event AND/OR and NOT another event.
Conditional Probability: Probability of one event given another has occurred.
Mutually Exclusive: Events that cannot occur together.
Independence: Occurrence of one event does not affect the other.
Example: The probability of drawing a red card from a deck, given a previous draw.
Modeling Random Events: The Normal and Binomial Models
Normal and Binomial Distributions
Normal and binomial distributions are fundamental models for random events.
Normal Distribution: Symmetric, bell-shaped curve; described by mean and standard deviation.
Z-Score: Standardizes data points:
Empirical Rule: 68-95-99.7% of data within 1, 2, 3 standard deviations.
Percentiles: Indicate relative standing of a value.
Binomial Distribution: Models number of successes in fixed number of trials.
Conditions for Binomial Model: Fixed number of trials, two outcomes, constant probability, independent trials.
Example: Calculating the probability of getting 3 heads in 5 coin tosses.
Survey Sampling and Inference
Sampling Distributions and Confidence Intervals
Sampling distributions describe the variability of sample statistics; confidence intervals estimate population parameters.
Mean and Standard Deviation of Sampling Distribution: Used to assess variability.
Confidence Interval: Range of values likely to contain the population parameter.
Margin of Error: Maximum expected difference between sample statistic and parameter.
Sample Size Calculation: Determines number of observations needed for desired precision.
Example: Estimating the proportion of students who pass an exam with a 95% confidence interval.
Hypothesis Testing for Population Proportions
One-Sample Z-Test for Proportions
Hypothesis testing evaluates claims about population proportions using sample data.
Null Hypothesis (H0): Statement of no effect or difference.
Alternative Hypothesis (HA): Statement of effect or difference.
Type I Error: Incorrectly rejecting H0.
Type II Error: Failing to reject H0 when it is false.
Z-Test: Used for large samples to test proportions.
Example: Testing if the proportion of students passing is greater than 0.7.
Inferring Population Means
One-Sample and Two-Sample T-Tests
Inference for means uses t-tests and confidence intervals to compare population averages.
One-Sample T-Test: Tests mean of a single population.
Two-Sample T-Test: Compares means of two independent or dependent groups.
Assumptions: Normality, independence, equal variances (for some tests).
Confidence Interval for Difference: Estimates difference between two means.
Example: Comparing average test scores between two classes.
Associations between Categorical Variables
Bar Graphs and Categorical Data Analysis
Bar graphs are used to visualize and compare categorical data.
Stacked Bar Graphs: Show proportions of categories within groups.
Side-by-Side Bar Graphs: Compare categories across groups.
Interpretation: Identifying differences and similarities between groups.
Example: Comparing gender distribution across departments.
Multiple Comparisons and Analysis of Variance
Comparing Means Across Groups
Analysis of variance (ANOVA) is used to compare means across multiple groups.
Multiple Comparisons: Testing differences between more than two groups.
ANOVA: Statistical method for comparing group means.
Example: Comparing average scores across three teaching methods.
Inference for Regression
Regression Model Inference
Inference for regression assesses the reliability of relationships between variables.
Confidence Interval for Slope: Estimates the range for the true slope.
Hypothesis Test for Slope: Tests if the slope is significantly different from zero.
Example: Testing if hours studied significantly predict exam scores.
Key Statistical Formulas
Essential Equations for Final Exam
The following formulas are fundamental for calculations in statistics, including hypothesis testing, confidence intervals, and descriptive statistics.
Z or T Score:
Sample Standard Deviation:
Degrees of Freedom:
Sample Size for Proportion:
Margin of Error:
Standard Error (Means):
Standard Error (Proportions):
Standard Error (Difference of Means):
Standard Error (Difference of Proportions):
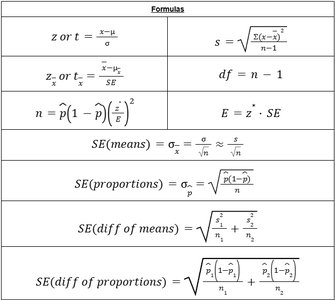
Table Purpose: The table summarizes essential formulas for descriptive statistics, hypothesis testing, and confidence interval calculations. It provides a quick reference for students during exam preparation.
