 Back
BackComprehensive Study Guide for Introductory Statistics Final Exam
Study Guide - Smart Notes
 Tailored notes based on your materials, expanded with key definitions, examples, and context.
Introduction to Data
Populations, Samples, Parameters, and Statistics
Understanding the basic elements of a statistical study is essential for interpreting results and designing experiments.
Population: The entire group of individuals or objects of interest.
Sample: A subset of the population selected for study.
Parameter: A numerical summary describing a characteristic of the population.
Statistic: A numerical summary describing a characteristic of the sample.
Observational Units: The individual entities on which measurements are taken.
Bias: Systematic error introduced by the sampling method, leading to non-representative results.
Picturing Variation with Graphs
Observational Studies vs. Experimental Design
Statistical studies can be classified as observational or experimental, each with distinct features and purposes.
Observational Study: Researchers observe subjects without intervention.
Experimental Study: Researchers manipulate variables to observe effects.
Key Components of Experimental Design:
Treatment: The intervention or condition applied.
Factor of Interest (Explanatory Variable): The variable manipulated by the researcher.
Response Variable (Dependent Variable): The outcome measured.
Nuisance Factors: Variables that may affect the response but are not of primary interest.
Random Assignment: Allocating subjects to treatments randomly to reduce bias.
Replication: Repeating the experiment to ensure reliability.
Numerical Summaries of Center and Variation
Describing Distributions
Statistical distributions are characterized by their shape, center, spread, and presence of outliers.
Shape: Symmetric, skewed, unimodal, bimodal, etc.
Center: Mean, median, mode.
Spread: Range, interquartile range (IQR), standard deviation.
Outliers: Extreme values that differ significantly from other observations.
Measures of Center
Mean: Arithmetic average.
Median: Middle value when data are ordered.
Mode: Most frequently occurring value.
Connection Between Distribution and Mean/Median
In symmetric distributions, mean and median are similar.
In skewed distributions, mean is pulled toward the tail.
Picturing Variation with Boxplots
Boxplots and Five-Number Summary
Boxplots visually summarize data using five key statistics.
Five-Number Summary: Minimum, Q1, Median, Q3, Maximum.
Interquartile Range (IQR):
Outliers: Values below or above
Standard Deviation: Measures average distance from the mean.
Regression Analysis: Exploring Associations between Variables
Bivariate Data and Correlation
Regression analysis explores relationships between two quantitative variables.
Trend: Direction and strength of association.
Correlation Coefficient (r): Measures linear association, ranges from -1 to 1.
Linear Regression Model: where is the slope and is the y-intercept.
Prediction: Using the line of best fit to estimate values.
Modeling Variation with Probability
Probability and Events
Probability quantifies the likelihood of events.
AND, OR, NOT:
AND: Intersection of events.
OR: Union of events.
NOT: Complement of an event.
Conditional Probability: Probability of one event given another.
Mutually Exclusive: Events that cannot occur together.
Independence: Occurrence of one event does not affect the other.
Modeling Random Events: The Normal and Binomial Models
Normal Distribution
The normal distribution is a symmetric, bell-shaped curve used to model many natural phenomena.
Standard Normal Curve: Mean = 0, SD = 1.
Z-score:
Empirical Rule: 68%-95%-99.7% of data within 1-2-3 SDs.
Percentiles: Indicate relative standing in the distribution.
Binomial Distribution
Conditions: Fixed number of trials, two outcomes, constant probability, independent trials.
Probability Model:
Survey Sampling and Inference
Sampling Distributions and Confidence Intervals
Sampling distributions describe the variability of sample statistics.
Mean and Standard Deviation of Sample Proportion: ,
Confidence Interval for Proportion:
Sample Size for Desired Margin of Error:
Hypothesis Testing for Population Proportions
One-Sample Z-Test for Proportions
Hypothesis testing evaluates claims about population proportions.
Null Hypothesis (): No effect or difference.
Alternative Hypothesis (): Presence of effect or difference.
Type I Error: Rejecting when it is true.
Type II Error: Failing to reject when it is false.
Inferring Population Means
One-Sample and Two-Sample t-Tests
t-tests are used to infer population means from sample data.
One-Sample t-Test:
Two-Sample t-Test: Compares means of two independent groups.
Confidence Interval for Mean:
Assumptions: Random sampling, normality, independence.
Dependent vs. Independent Samples
Dependent Samples: Paired or matched observations.
Independent Samples: Separate groups.
Associations between Categorical Variables
Bar Graphs and Categorical Data
Bar graphs are used to compare frequencies of categorical variables.
Stacked Bar Graphs: Show proportions within groups.
Side-by-Side Bar Graphs: Compare groups directly.
Interpretation: Differences in bar heights indicate associations.
Multiple Comparisons and Analysis of Variance
Comparing Means Across Groups
Analysis of variance (ANOVA) is used to compare means across multiple groups.
Replication: Ensures reliability of results.
Random Assignment: Reduces bias.
Inference for Regression
Regression and Prediction
Regression inference allows for estimation and hypothesis testing about relationships between variables.
Estimated Slope and Intercept: Used for prediction.
Standard Error: Quantifies uncertainty in estimates.
Key Statistical Formulas
Summary Table of Formulas
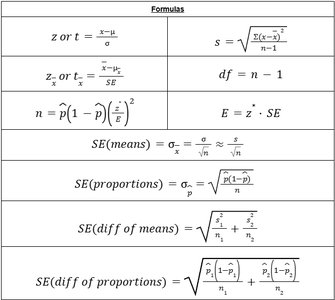
The following table summarizes essential formulas for statistics:
Formula | Description |
|---|---|
Z-score or t-score for a value | |
Sample standard deviation | |
Degrees of freedom | |
Sample size for desired margin of error | |
Margin of error | |
Standard error of the mean | |
Standard error of a proportion | |
Standard error of the difference of means | |
Standard error of the difference of proportions |
Additional info:
Links to online tools for statistical analysis are provided for further exploration and practice.
