 Back
BackComprehensive Study Notes for College Statistics: Biostatistics and Data Analysis
Study Guide - Smart Notes
 Tailored notes based on your materials, expanded with key definitions, examples, and context.
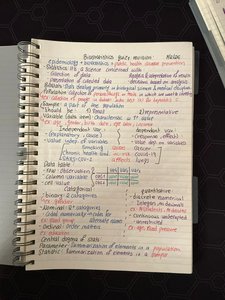
Introduction to Statistics and Collecting Data
What is Biostatistics?
Biostatistics is the application of statistical methods to biological, medical, and health sciences. It is essential for designing experiments, analyzing data, and interpreting results in epidemiology and clinical research.
Epidemiology: Study of disease occurrence and distribution in populations.
Clinical Trials: Experiments to assess medical interventions.
Variables: Characteristics measured in studies (e.g., blood pressure, age).
Types of Variables
Qualitative (Categorical): Describes categories or groups (e.g., gender, blood type).
Quantitative (Numerical): Measured numerically (e.g., height, weight).
Discrete: Countable values (e.g., number of children).
Continuous: Any value within a range (e.g., blood pressure).
Data Collection Methods
Observational Studies: No intervention; observe and record data.
Experimental Studies: Manipulate variables to assess effects.
Describing Data with Tables and Graphs
Data Presentation
Data can be summarized using tables and graphs to facilitate understanding and interpretation.
Frequency Tables: Show counts of data in categories.
Bar Charts: Visualize categorical data.
Histograms: Visualize numerical data distribution.
Boxplots: Summarize data spread and identify outliers.
Example Table: Types of Data
Type | Example |
|---|---|
Qualitative | Blood type |
Quantitative | Blood pressure |
Discrete | Number of children |
Continuous | Height |
Describing Data Numerically
Measures of Central Tendency
Central tendency describes the center of a data set.
Mean: Average value.
Median: Middle value when data is ordered.
Mode: Most frequently occurring value.
Measures of Dispersion
Range: Difference between maximum and minimum values.
Variance: Average squared deviation from the mean.
Standard Deviation: Square root of variance.
Boxplot Interpretation
Boxplots display the median, quartiles, and potential outliers in a data set.
Probability
Basic Probability Concepts
Probability quantifies the likelihood of events occurring.
Sample Space: All possible outcomes.
Event: A subset of outcomes.
Probability Formula:
Rules of Probability
Addition Rule: For mutually exclusive events,
Multiplication Rule: For independent events,
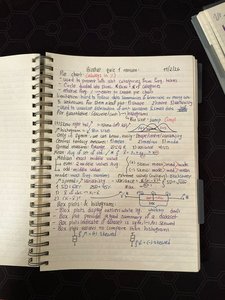
Binomial Distribution & Discrete Random Variables
Binomial Distribution
The binomial distribution models the number of successes in a fixed number of independent trials, each with the same probability of success.
Parameters: n (number of trials), p (probability of success).
Probability Formula:
Discrete Random Variables
Definition: Variables that take on distinct, separate values.
Example: Number of heads in 10 coin tosses.
Normal Distribution and Continuous Random Variables
Normal Distribution
The normal distribution is a continuous probability distribution characterized by its bell-shaped curve.
Parameters: Mean (μ), Standard deviation (σ).
Probability Density Function:
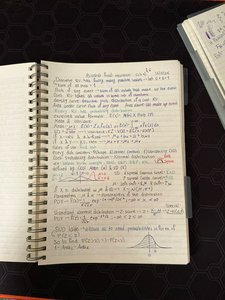
Sampling Distributions & Confidence Intervals: Mean
Sampling Distribution of the Mean
The sampling distribution describes the distribution of sample means from repeated samples.
Central Limit Theorem: For large n, the sampling distribution of the mean is approximately normal.
Standard Error:
Confidence Intervals for the Mean
Formula:
Interpretation: Range in which the true population mean is likely to fall.
Sampling Distributions & Confidence Intervals: Proportion
Confidence Intervals for Proportion
Formula:
Application: Used for estimating population proportions.
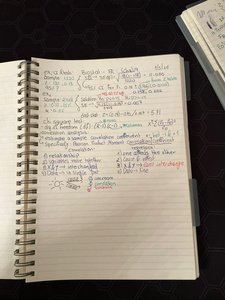
Hypothesis Testing for One Sample
Steps in Hypothesis Testing
State Hypotheses: Null (H0) and alternative (H1).
Choose Significance Level: Commonly α = 0.05.
Calculate Test Statistic:
Decision: Compare p-value to α.
Hypothesis Testing for Two Samples
Comparing Two Means
Independent Samples:
Paired Samples: Use differences between pairs.
Correlation
Correlation Coefficient
Correlation measures the strength and direction of the linear relationship between two variables.
Pearson's r:
Interpretation: r ranges from -1 (perfect negative) to +1 (perfect positive).
Regression
Simple Linear Regression
Regression models the relationship between a dependent variable and one or more independent variables.
Equation:
Interpretation: Predicts y from x.
Chi-Square Tests & Goodness of Fit
Chi-Square Test
The chi-square test assesses whether observed frequencies differ from expected frequencies.
Formula:
Application: Used for categorical data.
ANOVA
Analysis of Variance (ANOVA)
ANOVA compares means across multiple groups to determine if at least one group mean is different.
F-statistic:
Application: Used for comparing more than two groups.
Summary Table: Key Statistical Tests
Test | Purpose | Data Type |
|---|---|---|
t-test | Compare means | Numerical |
Chi-square | Compare frequencies | Categorical |
ANOVA | Compare means (3+ groups) | Numerical |
Correlation | Relationship between variables | Numerical |
Additional info: Some explanations and formulas were expanded for academic completeness and clarity. The notes cover all major topics relevant to a college statistics course, including biostatistics, data types, descriptive statistics, probability, distributions, hypothesis testing, correlation, regression, chi-square, and ANOVA.
