 Back
BackComprehensive Study Notes for Introductory Statistics
Study Guide - Smart Notes
 Tailored notes based on your materials, expanded with key definitions, examples, and context.
Introduction to Statistics
Definition and Scope
Statistics is the science of collecting, organizing, presenting, analyzing, predicting, and interpreting data to make informed decisions. It encompasses various methods for handling data and is foundational to many fields.
Sources of Data: Data can be collected by the researcher (primary data) or obtained from existing sources (secondary data).
Methods of Collecting Data: Includes observation, surveys, experiments, and focus groups.
Types of Data: Qualitative (attributes, labels, classifications) and Quantitative (numerical measurements or counts).
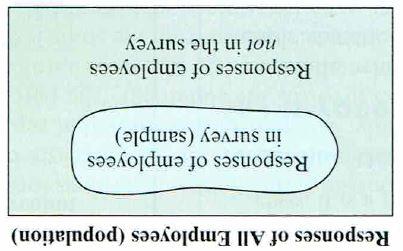
Scope of Data: Population (entire group of interest) vs. Sample (subset of the population).
Descriptive Statistics
Frequency Distributions
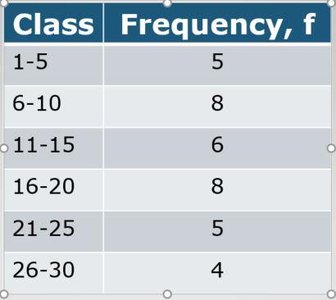
A frequency distribution organizes data into intervals (classes) and records the number of data points in each interval (frequency).
Class: Interval defined by lower and upper limits.
Class Width: Difference between consecutive class limits.
Range: Difference between maximum and minimum values.
Sample Size: Total number of data values.
Graphical Representations
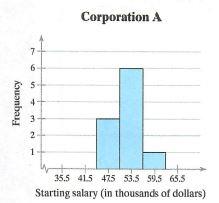
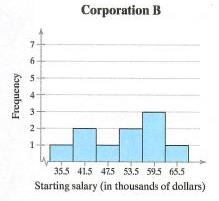
Frequency Histogram: Bar graph where bars touch, representing frequencies of quantitative classes.
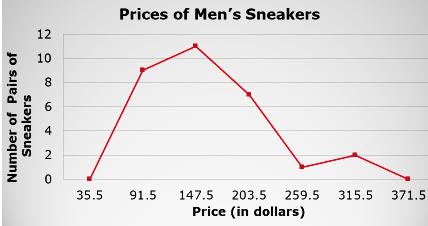
Frequency Polygon: Line graph connecting midpoints of classes.
Relative Frequency Histogram: Vertical axis shows relative frequencies.
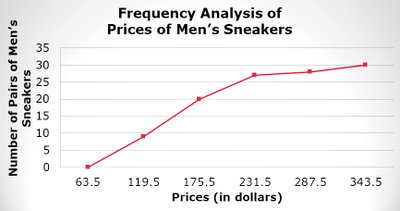
Cumulative Frequency Graph (Ogive): Line graph showing cumulative frequencies.
Other Graphs
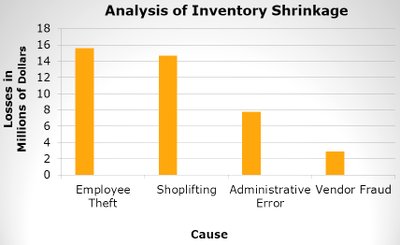
Pareto Chart: Bar graph with bars in decreasing order, used for categorical data.
Pie Chart: Circle divided into sectors proportional to category frequencies.
Measures of Central Tendency
Mean, Median, Mode
Mean: Arithmetic average, sensitive to outliers.
Median: Middle value when data is ordered, less affected by outliers.
Mode: Most frequently occurring value(s).
Outliers and Distribution Shape
Outlier: Data value far removed from others.
Distribution Shape: Symmetric, Uniform, Skewed-Left, Skewed-Right.
Measures of Variation
Range, Variance, Standard Deviation
Range:
Variance: for population, for sample
Standard Deviation:
Coefficient of Variation:
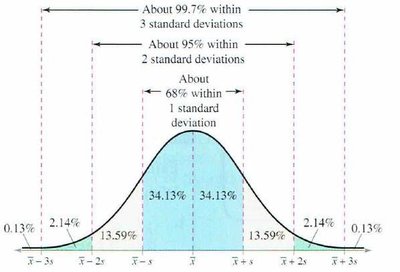
Empirical Rule
For bell-shaped (normal) distributions:
About 68% of data within 1 standard deviation
About 95% within 2 standard deviations
About 99.7% within 3 standard deviations
Measures of Position
Quartiles, Percentiles, Z-Scores
Quartiles: Divide data into four equal parts.
Interquartile Range (IQR):
Percentiles: Divide data into 100 equal parts.
Z-Score:
Correlation and Regression
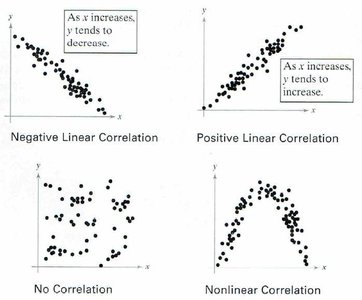
Correlation
Correlation Coefficient (r): Measures strength and direction of linear relationship.
Scatter Plot: Visualizes types of correlation: positive, negative, none, nonlinear.
Linear Regression
Regression Line: Line of best fit for predicting y from x.
Regression Equation:
Probability
Basic Concepts
Experiment: Action yielding outcomes.
Sample Space: Set of all possible outcomes.
Event: Subset of sample space.
Fundamental Counting Principle: If one event can occur in m ways and another in n ways, total ways = .
Probability Rules
Classical Probability:
Empirical Probability: Based on observed data.
Subjective Probability: Based on intuition or estimates.
Complementary Events:
Odds:
Probability Distributions
Discrete Probability Distributions
Discrete Random Variable: Takes countable values.
Probability Distribution: Lists each value and its probability.
Mean:
Variance:
Standard Deviation:
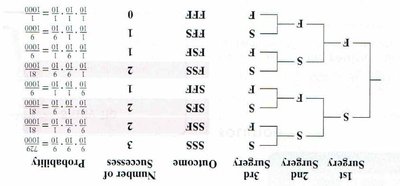
Binomial Distribution
Binomial Experiment: Fixed number of trials, two outcomes (success/failure), constant probability.
Binomial Probability Formula:
Normal Distribution
Normal Curve: Symmetrical, bell-shaped, mean = median = mode.
Standard Normal Distribution: Mean 0, standard deviation 1.
Probability Density Function:
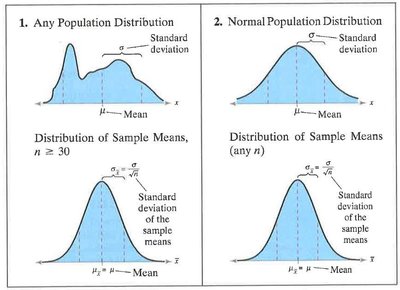
Sampling and Central Limit Theorem
Sampling Distributions
Sampling Distribution: Distribution of a sample statistic over repeated samples.
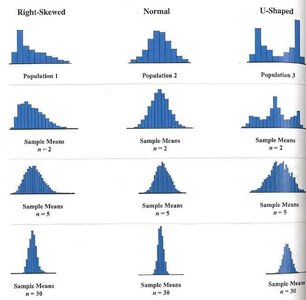
Central Limit Theorem: For large n, sampling distribution of sample mean is approximately normal.
Standard Error:
Confidence Intervals
Point and Interval Estimates
Point Estimate: Single value estimate of a parameter.
Interval Estimate: Range of values likely to contain the parameter.
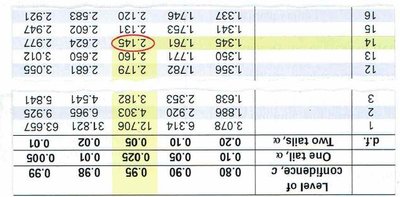
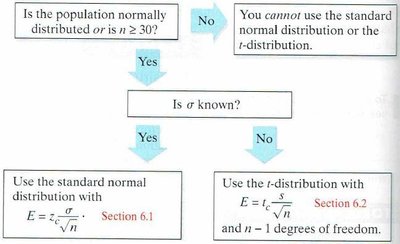
Margin of Error: (if known), (if $\sigma$ unknown)
Hypothesis Testing
Steps in Hypothesis Testing
State the null () and alternative () hypotheses.
Specify the significance level ().
Determine the appropriate test statistic (z or t).
Calculate the test statistic and p-value.
Make a decision: reject or fail to reject .
Interpret the result in context.
Types of Errors
Type I Error: Rejecting when it is true.
Type II Error: Failing to reject when it is false.
Hypothesis Testing with Two Samples
Independent vs. Dependent Samples
Independent Samples: Samples from different populations.
Dependent Samples: Paired or matched samples.
Testing Differences
Null hypothesis: No difference in means.
Test statistic for difference:
Chi-Square Tests and F-Distribution
Chi-Square Test
Used for categorical data to test independence or goodness-of-fit.
F-Distribution
Used to compare variances between two populations.
Tables and Data
Sample Tables
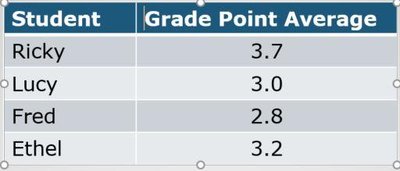
Tables are used to summarize and compare data, such as frequency distributions, grade point averages, and critical values.
Student | Grade Point Average |
|---|---|
Ricky | 3.7 |
Lucy | 3.0 |
Fred | 2.8 |
Ethel | 3.2 |
Class | Frequency, f |
|---|---|
1-5 | 5 |
6-10 | 8 |
11-15 | 6 |
16-20 | 8 |
21-25 | 5 |
26-30 | 4 |
*Additional info: Academic context and explanations have been expanded for clarity and completeness. Only images directly relevant to the adjacent content have been included.*
