 Back
BackComprehensive Study Notes for Introductory Statistics
Study Guide - Smart Notes
 Tailored notes based on your materials, expanded with key definitions, examples, and context.
Introduction to Statistics
Key Concepts in Statistics
Statistics is the science of collecting, organizing, analyzing, and interpreting data to make decisions. Understanding the foundational terms and distinctions is essential for further study.
Data: Information from observations, counts, measurements, or responses.
Population: The entire group of interest in a study.
Sample: A subset of the population.
Parameter: A numerical description of a population characteristic.
Statistic: A numerical description of a sample characteristic.
Descriptive Statistics: Methods for organizing, summarizing, and displaying data.
Inferential Statistics: Methods for drawing conclusions about a population based on sample data, often using probability.
Example: If you survey 100 students about their study habits, the group of 100 is a sample, while all students at the school would be the population.
Descriptive Statistics
Data Classification
Data can be classified by type and level of measurement:
Qualitative (Categorical) Data: Non-numerical attributes or labels (e.g., eye color).
Quantitative Data: Numerical values representing counts or measurements (e.g., height).
Levels of Measurement:
Nominal: Qualitative only; no mathematical operations (e.g., movie genres).
Ordinal: Qualitative or quantitative; can be ordered or ranked (e.g., shirt sizes).
Interval: Quantitative; differences are meaningful, but zero is not inherent (e.g., temperature in Celsius).
Ratio: Quantitative; zero is inherent, and ratios are meaningful (e.g., weight).
Frequency Distributions and Graphs
Frequency distributions organize data into classes and show the number of entries in each class. Key terms include:
Class Limits: The smallest and largest values in each class.
Class Midpoint: The average of the lower and upper class limits.
Class Frequency: The number of data entries in a class.
Relative Frequency: The proportion of data entries in a class.
Cumulative Frequency: The running total of frequencies up to a certain class.
Range: The difference between the maximum and minimum values.
Class Width: The difference between consecutive lower (or upper) class limits.
Visual representations include histograms, relative frequency histograms, and ogives (cumulative frequency graphs).
Graphical Displays
Stem-and-Leaf Plot: Splits data values into a "stem" and a "leaf" for quick visualization.
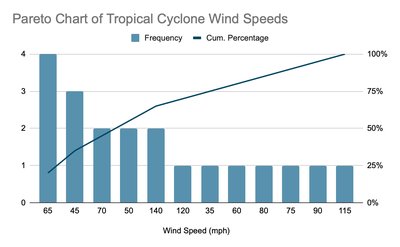
Pareto Chart: Bar graph of frequencies, ordered from highest to lowest.
Dot Plot: Dots represent frequencies for each value.
Scatter Plot: Plots pairs of data to show relationships.
Time Series Chart: Line graph showing data points over time.
Bar Graph and Pie Chart: Visualize categorical data as bars or sectors of a circle.
Measures of Central Tendency
Central tendency describes the center of a data set:
Mean (Average): Sum of all data values divided by the number of values.
Median: The middle value when data is ordered.
Mode: The value that appears most frequently.
Bimodal: Two modes.
Outlier: A value significantly different from others.
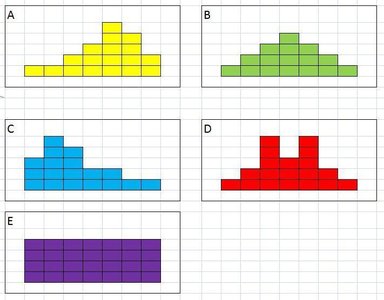
Data distributions can be symmetric, skewed left, skewed right, bimodal, or uniform.
Measures of Variation
Variation describes the spread of data:
Range: Maximum minus minimum value.
Variance: Average squared deviation from the mean.
Standard Deviation: Square root of variance; measures average distance from the mean.
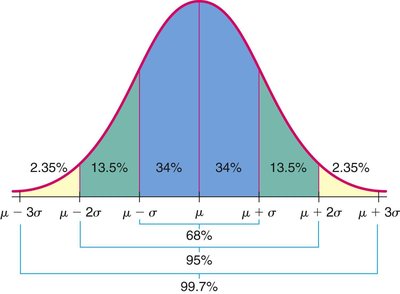
Empirical Rule: For normal distributions:
68% of data within 1 standard deviation of the mean
95% within 2 standard deviations
99.7% within 3 standard deviations
Measures of Position
Percentile: Value below which a given percentage of observations fall.
Quartiles: Divide data into four equal parts (Q1, Q2/median, Q3).
Interquartile Range (IQR): Q3 - Q1; measures the spread of the middle 50% of data.
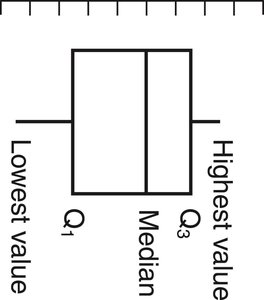
Five-Number Summary: Minimum, Q1, Median, Q3, Maximum.
Boxplot: Visual representation of the five-number summary.
Standard Score (z-score): Number of standard deviations a value is from the mean:
Probability
Basic Concepts
Outcome: Result of a single trial.
Sample Space: Set of all possible outcomes.
Event: Subset of the sample space.
Classical Probability:
Empirical Probability:
Subjective Probability: Based on intuition or experience.
Law of Large Numbers: Empirical probability approaches theoretical probability as the number of trials increases.
Range of Probability:
Complement:
Counting Principles
Fundamental Counting Principle: If one event can occur in m ways and another in n ways, both can occur in ways.
Permutations: Arrangements where order matters:
Combinations: Selections where order does not matter:
Distinguishable Permutations: for repeated items.
Rules of Probability
Multiplication Rule: For independent events, ; for dependent events,
Addition Rule: ; if mutually exclusive,
Discrete Probability Distributions
Random Variables and Distributions
Random Variable: A variable whose value is a numerical outcome of a random phenomenon.
Discrete Random Variable: Takes on countable values.
Continuous Random Variable: Takes on any value in an interval.
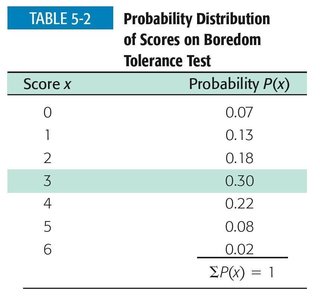
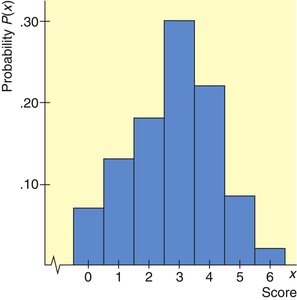
Probability Distribution: Assigns probabilities to each value of a discrete random variable. The sum of all probabilities is 1.
Mean (Expected Value): Variance: Standard Deviation:
Score x | Probability P(x) |
|---|---|
0 | 0.07 |
1 | 0.13 |
2 | 0.18 |
3 | 0.30 |
4 | 0.22 |
5 | 0.08 |
6 | 0.02 |
Binomial Distributions
Binomial Experiment: Fixed number of independent trials, each with two possible outcomes (success/failure), and constant probability of success.
Binomial Probability Formula:
Mean:
Variance:
Standard Deviation:
Normal Probability Distributions
Properties of the Normal Distribution
Bell-shaped and symmetric about the mean
Total area under the curve is 1
Inflection points at and
Standard Normal Distribution: Mean 0, standard deviation 1
Finding Probabilities and Data Values
z-score:
Use z-tables to find probabilities for normal distributions.
To find a data value for a given probability, use the inverse normal distribution:
Confidence Intervals
Estimating Population Parameters
Point Estimate: Single value estimate of a parameter.
Interval Estimate (Confidence Interval): Range of values likely to contain the parameter.
Critical Value ( or ): Value corresponding to the desired confidence level.
Margin of Error (E): Maximum expected difference between the point estimate and the true parameter.
Confidence Interval for Mean (σ known):
Confidence Interval for Mean (σ unknown):
Confidence Interval for Proportion:
Hypothesis Testing with One Sample
Formulating and Testing Hypotheses
Null Hypothesis (H₀): Statement of no effect or status quo (contains equality).
Alternative Hypothesis (H₁ or Ha): Statement we are testing for (contains inequality).
Type I Error: Rejecting H₀ when it is true (false positive).
Type II Error: Failing to reject H₀ when it is false (false negative).
Level of Significance (α): Probability of making a Type I error (commonly 0.05 or 0.01).
Test Statistic: Standardized value used to decide whether to reject H₀.
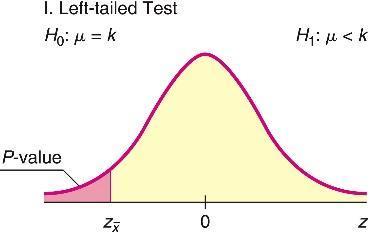
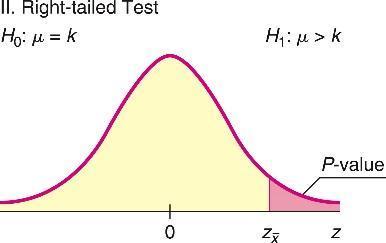
P-value: Probability of obtaining a result as extreme as the observed, assuming H₀ is true.
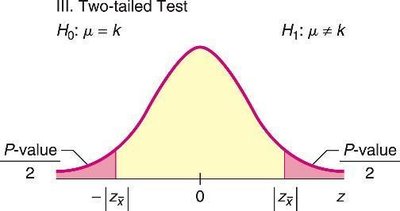
Test Types:
Left-tailed: Ha: μ < k
Right-tailed: Ha: μ > k
Two-tailed: Ha: μ ≠ k
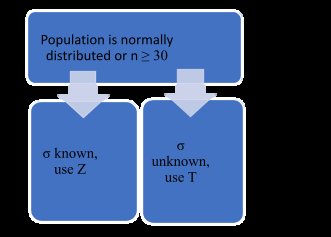
Choosing the Test:
Correlation and Regression
Correlation
Correlation: Measures the strength and direction of a linear relationship between two variables.
Correlation Coefficient (r): Ranges from -1 (perfect negative) to +1 (perfect positive); 0 means no linear correlation.
Scatter Plot: Visualizes the relationship between two variables.
Regression
Regression Line (Line of Best Fit): The line that best models the relationship between two variables, minimizing the sum of squared residuals.
Residual: The difference between an observed value and the value predicted by the regression line.
Interpolation: Predicting within the range of observed data.
Extrapolation: Predicting outside the range of observed data (less reliable).
Additional info: This guide covers the foundational topics in introductory statistics, including descriptive and inferential statistics, probability, probability distributions, normal distributions, confidence intervals, hypothesis testing, and correlation/regression. All formulas are provided in LaTeX format for clarity and academic rigor.
